
User`s guide
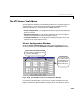
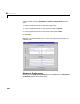
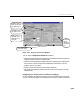
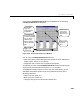
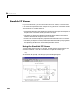
Table Of Contents
- Preface
- Quick Start
- LTI Models
- Introduction
- Creating LTI Models
- LTI Properties
- Model Conversion
- Time Delays
- Simulink Block for LTI Systems
- References
- Operations on LTI Models
- Arrays of LTI Models
- Model Analysis Tools
- The LTI Viewer
- Introduction
- Getting Started Using the LTI Viewer: An Example
- The LTI Viewer Menus
- The Right-Click Menus
- The LTI Viewer Tools Menu
- Simulink LTI Viewer
- Control Design Tools
- The Root Locus Design GUI
- Introduction
- A Servomechanism Example
- Controller Design Using the Root Locus Design GUI
- Additional Root Locus Design GUI Features
- References
- Design Case Studies
- Reliable Computations
- Reference
- Category Tables
- acker
- append
- augstate
- balreal
- bode
- c2d
- canon
- care
- chgunits
- connect
- covar
- ctrb
- ctrbf
- d2c
- d2d
- damp
- dare
- dcgain
- delay2z
- dlqr
- dlyap
- drmodel, drss
- dsort
- dss
- dssdata
- esort
- estim
- evalfr
- feedback
- filt
- frd
- frdata
- freqresp
- gensig
- get
- gram
- hasdelay
- impulse
- initial
- inv
- isct, isdt
- isempty
- isproper
- issiso
- kalman
- kalmd
- lft
- lqgreg
- lqr
- lqrd
- lqry
- lsim
- ltiview
- lyap
- margin
- minreal
- modred
- ndims
- ngrid
- nichols
- norm
- nyquist
- obsv
- obsvf
- ord2
- pade
- parallel
- place
- pole
- pzmap
- reg
- reshape
- rlocfind
- rlocus
- rltool
- rmodel, rss
- series
- set
- sgrid
- sigma
- size
- sminreal
- ss
- ss2ss
- ssbal
- ssdata
- stack
- step
- tf
- tfdata
- totaldelay
- zero
- zgrid
- zpk
- zpkdata
- Index

The LTI Viewer Tools Menu
6-43
The Frequency vector (rad/sec.) field also provides you with the option to
recalculateanew frequencyvectorforeach frequencyresponsetype.Whenthis
checkbox is selected along with
Generate automatically, a new frequency
vector and response is calculated each time you toggle between different
frequencyresponses,e.g.from Bode to Nyquist.If you deselectthe
Recalculate
for each response type
checkbox, the frequency vector used to calculate the
previous frequencyresponse is used and the frequency response datais simply
converted to the new response type.
Note: WheneveryouoverrideanyofthedefaultsettingsintheResponse
Preferences
window,thevaluesyouenterareusedoneachplot,andduring
every applicable response calculation.
Customizing Step Response Specifications
You can also use the Response Preferences window to customize the
percentage values used in the step response settling time or rise time
calculation.
The settling time percentage value determines the time after which the
envelope of the step response remains within that percentage of the steady
state value of the step response.
Therise time percentages are marked by two values. These determine the time
it takes for the step response to increase from the first percentage value to the
second percentage value of the steady state step value response.
The d efault values for these step response characteristics are:
• 2% of the steady state value for settling time
• 10% to 90% of the steady state value for rise time
You can use the editable text box in the
Plot Option sectionoftheTime
Domain
field shown below to change the percentages for the settling time or