
User`s guide
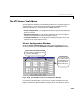
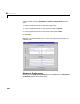
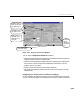

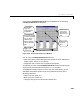
Table Of Contents
- Preface
- Quick Start
- LTI Models
- Introduction
- Creating LTI Models
- LTI Properties
- Model Conversion
- Time Delays
- Simulink Block for LTI Systems
- References
- Operations on LTI Models
- Arrays of LTI Models
- Model Analysis Tools
- The LTI Viewer
- Introduction
- Getting Started Using the LTI Viewer: An Example
- The LTI Viewer Menus
- The Right-Click Menus
- The LTI Viewer Tools Menu
- Simulink LTI Viewer
- Control Design Tools
- The Root Locus Design GUI
- Introduction
- A Servomechanism Example
- Controller Design Using the Root Locus Design GUI
- Additional Root Locus Design GUI Features
- References
- Design Case Studies
- Reliable Computations
- Reference
- Category Tables
- acker
- append
- augstate
- balreal
- bode
- c2d
- canon
- care
- chgunits
- connect
- covar
- ctrb
- ctrbf
- d2c
- d2d
- damp
- dare
- dcgain
- delay2z
- dlqr
- dlyap
- drmodel, drss
- dsort
- dss
- dssdata
- esort
- estim
- evalfr
- feedback
- filt
- frd
- frdata
- freqresp
- gensig
- get
- gram
- hasdelay
- impulse
- initial
- inv
- isct, isdt
- isempty
- isproper
- issiso
- kalman
- kalmd
- lft
- lqgreg
- lqr
- lqrd
- lqry
- lsim
- ltiview
- lyap
- margin
- minreal
- modred
- ndims
- ngrid
- nichols
- norm
- nyquist
- obsv
- obsvf
- ord2
- pade
- parallel
- place
- pole
- pzmap
- reg
- reshape
- rlocfind
- rlocus
- rltool
- rmodel, rss
- series
- set
- sgrid
- sigma
- size
- sminreal
- ss
- ss2ss
- ssbal
- ssdata
- stack
- step
- tf
- tfdata
- totaldelay
- zero
- zgrid
- zpk
- zpkdata
- Index
The LTI Viewer Tools Menu
6-39
The LTI Viewer Tools Menu
Three preferences windows provide additional options for customizingthe LTI
Viewer display. You can access these windows from the
Tools menu. The
preference windows you can access from the
Tools menu are:
•
Viewer Configuration—To change the number and type of plots displayed
by the LTI Viewer
•
Response Preferences—To set various parameters such as the ranges of
values for the response plot time and frequency scales
•
Linestyle Preferences—To set options for changing linestyles, colors, and
markers for all of the response curves
Viewer Configuration Window
Select the Viewer Configuration menu item under the Tools menu. The
following window opens the
Available LTI Viewer Configurations window.
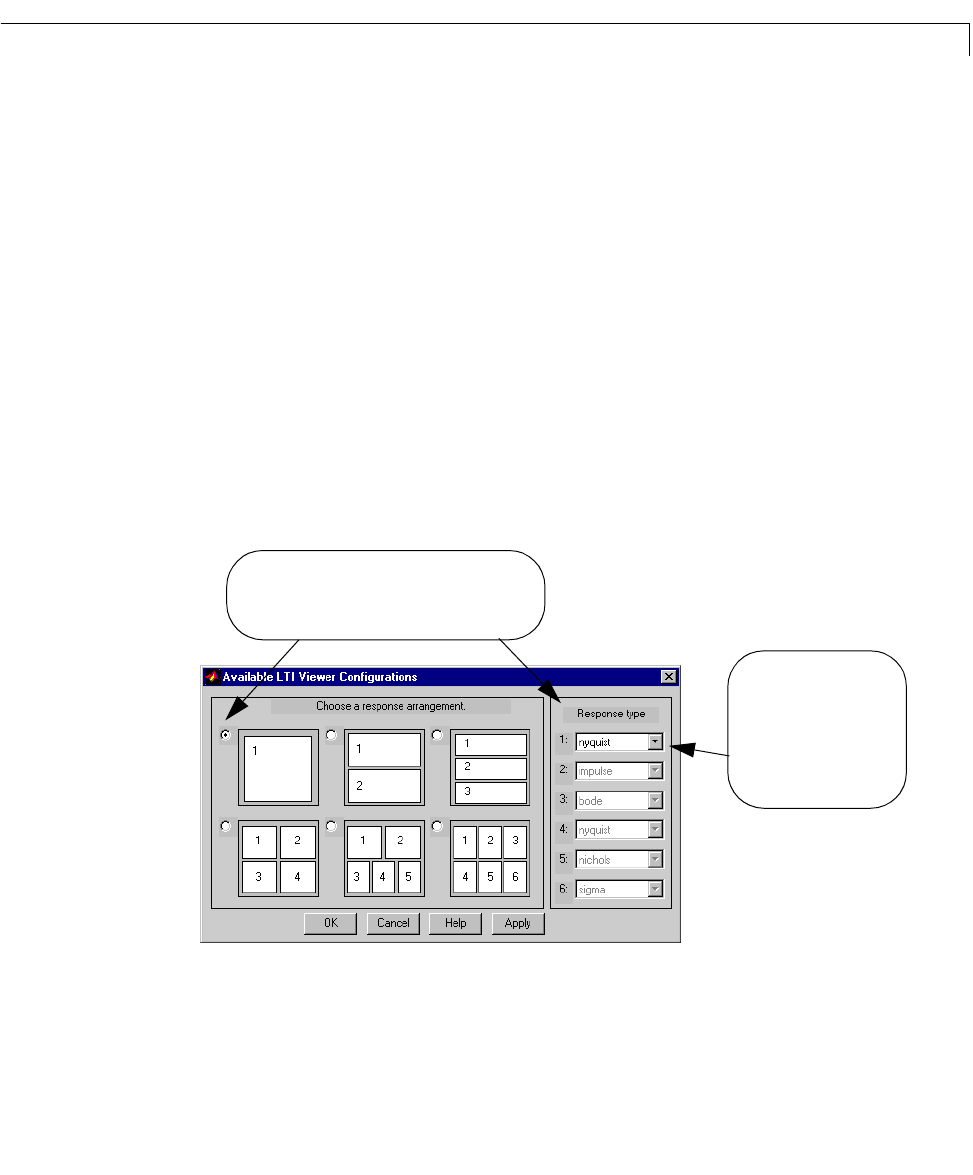
Figure 6-20: The Available LTI Viewer Configurations Window
For example, load the model ssF8 intotheLTIViewerworkspace(see“The
Right-Cl ick Menu for MIMO Models” on page 6-21 for instructions on how to
Choose response plot types
to correspond to your chosen
plot configuration here. Each
of these pull-down tabs lists
all of the possible plot types.
Select one of these six plot configuration radio buttons,
and then select the corresponding response plot types
to be mapped to that configuration.