
User`s guide

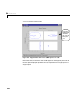
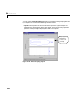
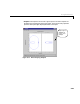
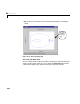
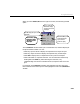
Table Of Contents
- Preface
- Quick Start
- LTI Models
- Introduction
- Creating LTI Models
- LTI Properties
- Model Conversion
- Time Delays
- Simulink Block for LTI Systems
- References
- Operations on LTI Models
- Arrays of LTI Models
- Model Analysis Tools
- The LTI Viewer
- Introduction
- Getting Started Using the LTI Viewer: An Example
- The LTI Viewer Menus
- The Right-Click Menus
- The LTI Viewer Tools Menu
- Simulink LTI Viewer
- Control Design Tools
- The Root Locus Design GUI
- Introduction
- A Servomechanism Example
- Controller Design Using the Root Locus Design GUI
- Additional Root Locus Design GUI Features
- References
- Design Case Studies
- Reliable Computations
- Reference
- Category Tables
- acker
- append
- augstate
- balreal
- bode
- c2d
- canon
- care
- chgunits
- connect
- covar
- ctrb
- ctrbf
- d2c
- d2d
- damp
- dare
- dcgain
- delay2z
- dlqr
- dlyap
- drmodel, drss
- dsort
- dss
- dssdata
- esort
- estim
- evalfr
- feedback
- filt
- frd
- frdata
- freqresp
- gensig
- get
- gram
- hasdelay
- impulse
- initial
- inv
- isct, isdt
- isempty
- isproper
- issiso
- kalman
- kalmd
- lft
- lqgreg
- lqr
- lqrd
- lqry
- lsim
- ltiview
- lyap
- margin
- minreal
- modred
- ndims
- ngrid
- nichols
- norm
- nyquist
- obsv
- obsvf
- ord2
- pade
- parallel
- place
- pole
- pzmap
- reg
- reshape
- rlocfind
- rlocus
- rltool
- rmodel, rss
- series
- set
- sgrid
- sigma
- size
- sminreal
- ss
- ss2ss
- ssbal
- ssdata
- stack
- step
- tf
- tfdata
- totaldelay
- zero
- zgrid
- zpk
- zpkdata
- Index
6 The LTI Viewer
6-20
are in the LTI Viewer workspace, but their responses are not displayed on
the plot associated with the open menu.
- You can select any model in the list with your mouse to toggle on (or off)
the visibility of its response curve in the selected plot region.
•
Characteristics—You can toggle on and off the option to display a marker
forvarious responsecharacteristicsfor each plot type.Formore information,
see “Displaying Response Characteristics on a Plot” on page 6-9.
Figure 6-7: The Characteristics Submenu for the Step Response
• Zoom—You can zoom in or out of a given plot using the four submenu items
in the
Zoom me nu. For more information, see “Zo oming” on page 6-12 .
•
Grid—You can toggle a grid on and off by selecting this menu item.
Selecting a Menu Item
To select a ny menu item on the right-click menu:
1 Move your mouse over the menu item until it becomes highlighted, and its
submenu (if i t has one) is disp lay ed .
2 Click on any (sub)menu item you want to select:
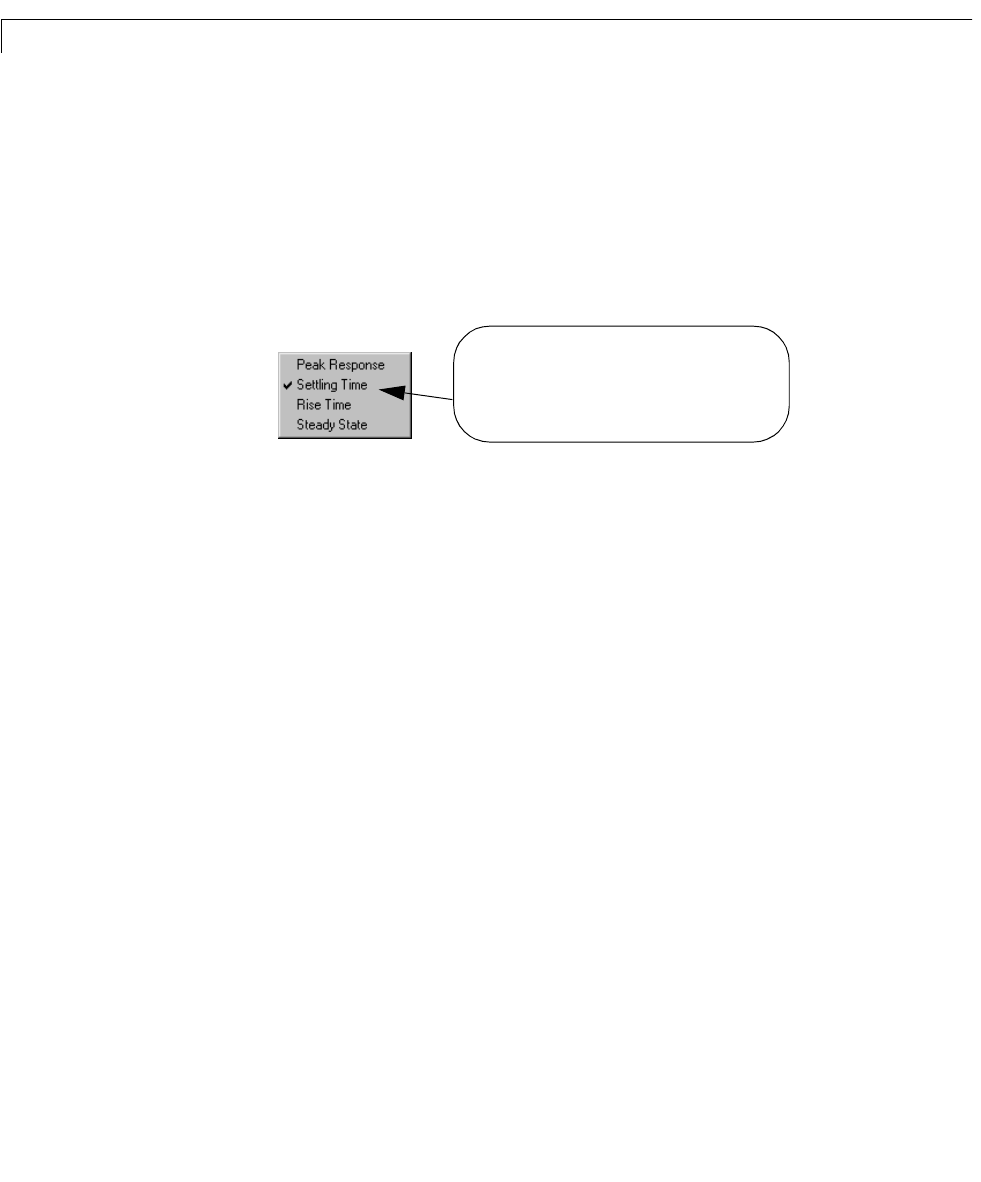
a For options menus such as Cha racteris tics and Systems: If the menu
item does no t have a check next to it, selecting the me nu item will
produceachecknextt ot hatitem. Selectingacheckeditem unchecksthat
menu selectio n ( dese lect s that menu o ptio n).
b For exclusive menus such as Plot Type, one menu item must be checked,
and select in g a plot type other than th e one checked cha nge s the plot typ e
according to your selection.
A check mark indicates that the characteristic is
displayed on the plot. You can multiselect these submenu
items one at a time, by re-opening the right-click menu.