
User`s guide
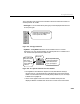
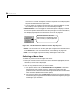
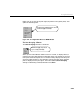
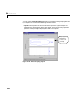
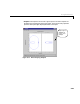
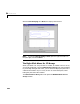
Table Of Contents
- Preface
- Quick Start
- LTI Models
- Introduction
- Creating LTI Models
- LTI Properties
- Model Conversion
- Time Delays
- Simulink Block for LTI Systems
- References
- Operations on LTI Models
- Arrays of LTI Models
- Model Analysis Tools
- The LTI Viewer
- Introduction
- Getting Started Using the LTI Viewer: An Example
- The LTI Viewer Menus
- The Right-Click Menus
- The LTI Viewer Tools Menu
- Simulink LTI Viewer
- Control Design Tools
- The Root Locus Design GUI
- Introduction
- A Servomechanism Example
- Controller Design Using the Root Locus Design GUI
- Additional Root Locus Design GUI Features
- References
- Design Case Studies
- Reliable Computations
- Reference
- Category Tables
- acker
- append
- augstate
- balreal
- bode
- c2d
- canon
- care
- chgunits
- connect
- covar
- ctrb
- ctrbf
- d2c
- d2d
- damp
- dare
- dcgain
- delay2z
- dlqr
- dlyap
- drmodel, drss
- dsort
- dss
- dssdata
- esort
- estim
- evalfr
- feedback
- filt
- frd
- frdata
- freqresp
- gensig
- get
- gram
- hasdelay
- impulse
- initial
- inv
- isct, isdt
- isempty
- isproper
- issiso
- kalman
- kalmd
- lft
- lqgreg
- lqr
- lqrd
- lqry
- lsim
- ltiview
- lyap
- margin
- minreal
- modred
- ndims
- ngrid
- nichols
- norm
- nyquist
- obsv
- obsvf
- ord2
- pade
- parallel
- place
- pole
- pzmap
- reg
- reshape
- rlocfind
- rlocus
- rltool
- rmodel, rss
- series
- set
- sgrid
- sigma
- size
- sminreal
- ss
- ss2ss
- ssbal
- ssdata
- stack
- step
- tf
- tfdata
- totaldelay
- zero
- zgrid
- zpk
- zpkdata
- Index
The Right-Click Menus
6-19
This isthe right-clickmenu forSISOmodels. These menu items control the LTI
Viewer plots for all models:
•
Plot Type—Youcan choosewhich plot typeyou wantdisplayedfrom thislist
of nine plot types.
Figure 6-5: Plot Type Submenu
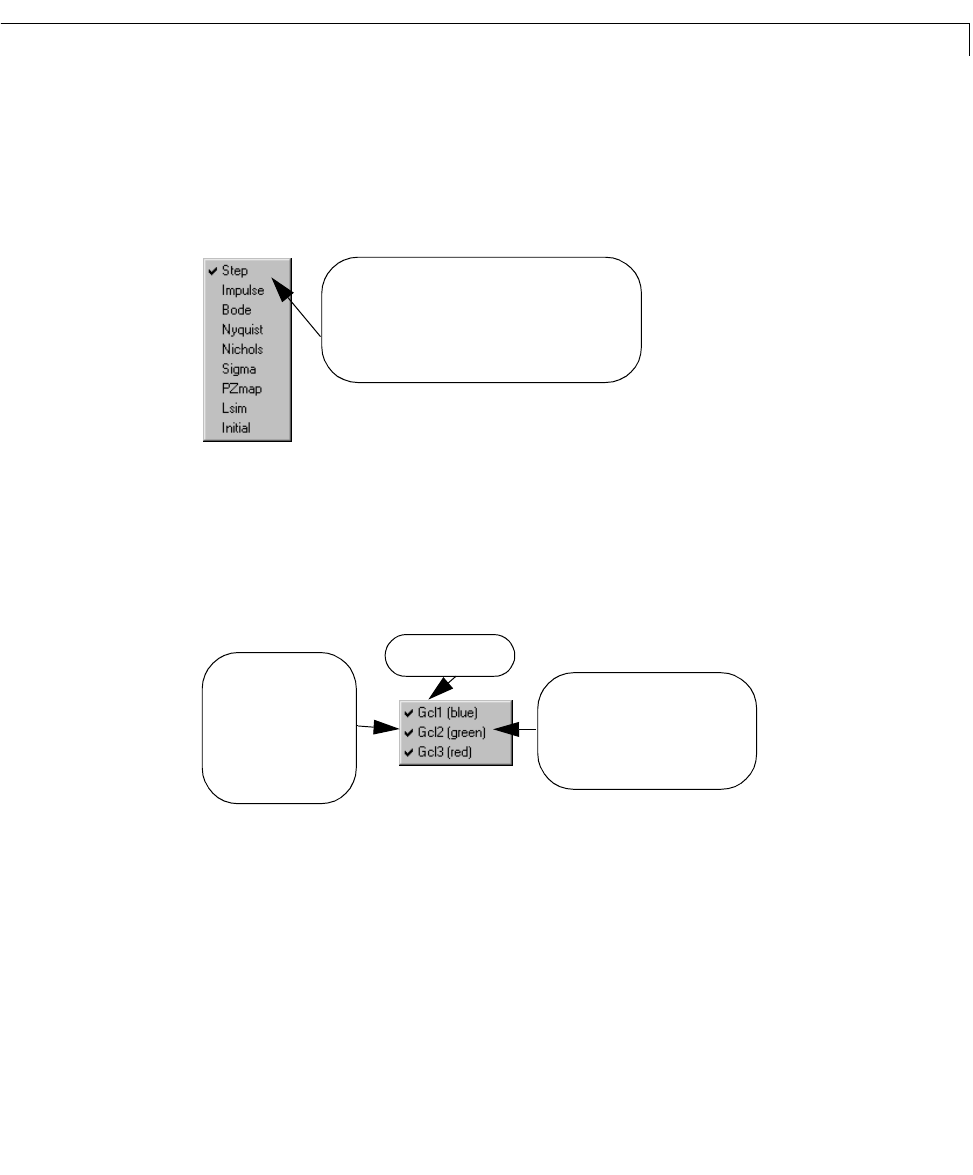
• Systems—The Systems submenu lists the models in the LTI Viewer
workspace. You can choose to display or hide the plots of LTI models in the
LTI View er workspace from this menu item:
Figure 6-6: The Systems Submenu for Three Models
- The legend for the individual response curves (described as linestyle,
marker types, or color preferences) is indicated next to t he na me of e ach
model. For information on how to modify these preferences, see “Linestyle
Preferences” on page 6-44.
- Check marks appear next to the names of models whose plots are
displayed. Names of models that do not have a check mark next to them
The check mark next to the plot type indicates your
selection for the type of plot displayed. You can
select from any of the items on this list.
The color (in parentheses) is a
legend item that indicates the
style in which each model’s
response plot is displayed.
The check mark next to
a model name indicates
that the model’s
response is displayed
on the plot that brought
up this menu.
LTI model name