
User`s guide
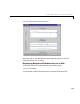
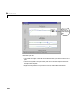
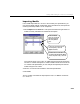
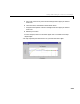
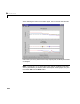
Table Of Contents
- Preface
- Quick Start
- LTI Models
- Introduction
- Creating LTI Models
- LTI Properties
- Model Conversion
- Time Delays
- Simulink Block for LTI Systems
- References
- Operations on LTI Models
- Arrays of LTI Models
- Model Analysis Tools
- The LTI Viewer
- Introduction
- Getting Started Using the LTI Viewer: An Example
- The LTI Viewer Menus
- The Right-Click Menus
- The LTI Viewer Tools Menu
- Simulink LTI Viewer
- Control Design Tools
- The Root Locus Design GUI
- Introduction
- A Servomechanism Example
- Controller Design Using the Root Locus Design GUI
- Additional Root Locus Design GUI Features
- References
- Design Case Studies
- Reliable Computations
- Reference
- Category Tables
- acker
- append
- augstate
- balreal
- bode
- c2d
- canon
- care
- chgunits
- connect
- covar
- ctrb
- ctrbf
- d2c
- d2d
- damp
- dare
- dcgain
- delay2z
- dlqr
- dlyap
- drmodel, drss
- dsort
- dss
- dssdata
- esort
- estim
- evalfr
- feedback
- filt
- frd
- frdata
- freqresp
- gensig
- get
- gram
- hasdelay
- impulse
- initial
- inv
- isct, isdt
- isempty
- isproper
- issiso
- kalman
- kalmd
- lft
- lqgreg
- lqr
- lqrd
- lqry
- lsim
- ltiview
- lyap
- margin
- minreal
- modred
- ndims
- ngrid
- nichols
- norm
- nyquist
- obsv
- obsvf
- ord2
- pade
- parallel
- place
- pole
- pzmap
- reg
- reshape
- rlocfind
- rlocus
- rltool
- rmodel, rss
- series
- set
- sgrid
- sigma
- size
- sminreal
- ss
- ss2ss
- ssbal
- ssdata
- stack
- step
- tf
- tfdata
- totaldelay
- zero
- zgrid
- zpk
- zpkdata
- Index
6 The LTI Viewer
6-18
The Right-Click Menus
You can access most of the controls for the individual response plots displayed
by the LTI Viewer through the right-click menus located in any plot region.
There is one right-click menu per plot region displayed on the LTI Viewer.
These menus vary slightly, depending on the model dimensions and plot type:
• The menu items that appear on the plot regions of the responses for SISO
models are the basic right -click menu items.
• Addition al menu items appear when you are displaying the plots of MIMO
LTI models or LTI arrays.
You can’t access th e right- c lick menu for the LTI View er plots until at least one
response plot is displayed in the LTI Viewer.
The Right-Click Menu for SISO Models
If you have not already done so, l oad the three S ISO LTI models i nto the LTI
Viewer workspace. You can do this by typing
load LTIexamples
ltiview({'step';'bode'},Gcl1,Gcl2,Gcl3)
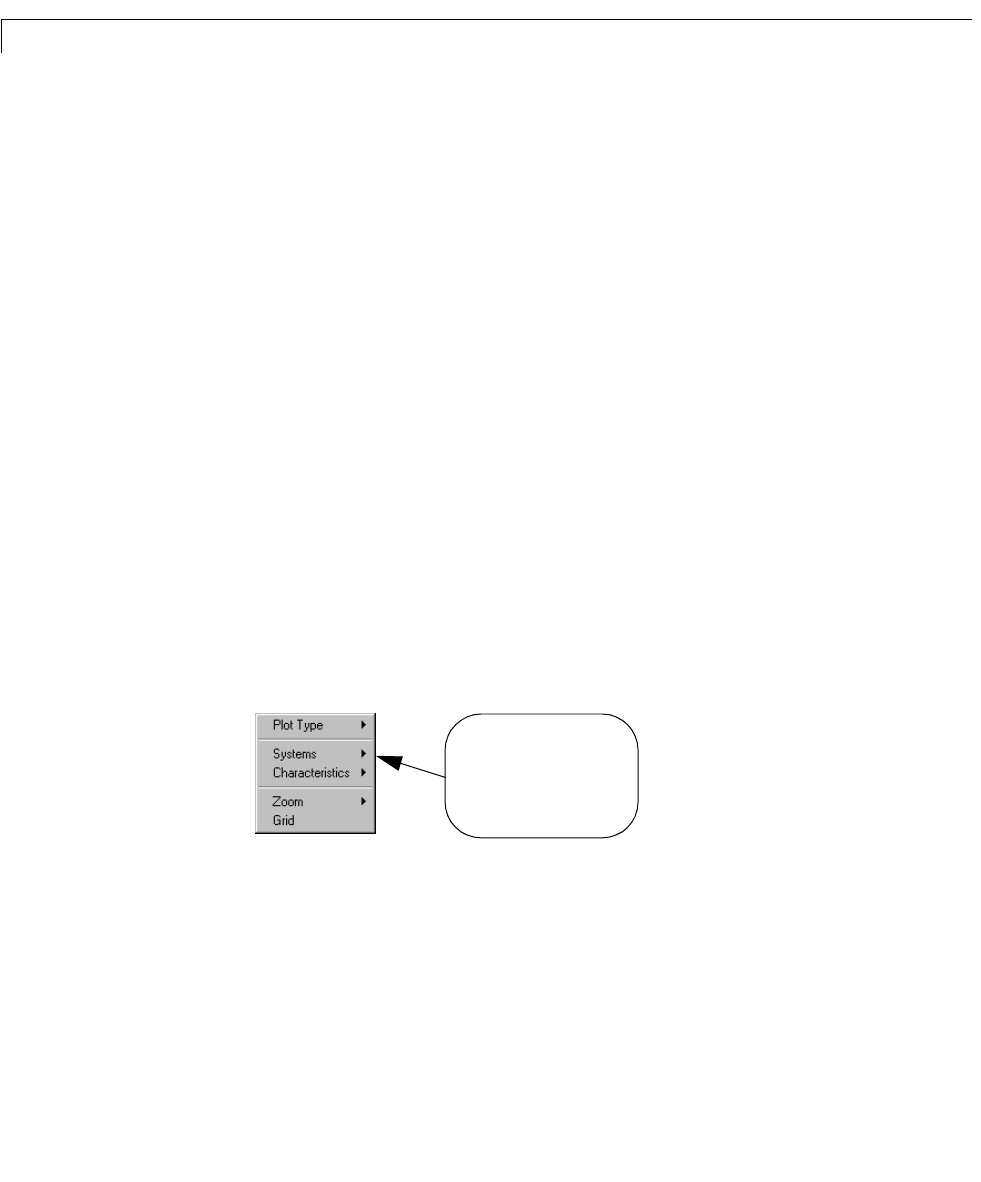
Onceyou haveloaded modelsinto the LTIViewer, right-clickon theplot region
of the step response plot. The following menu appears in the plot region.
Figure 6-4: The Right-Click Menu for SISO Models
Each arrow next to a menu
item opens a submenu list
when you select the menu
item.