
User`s guide
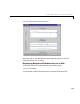
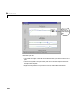
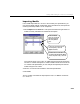
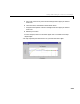
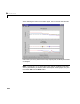
Table Of Contents
- Preface
- Quick Start
- LTI Models
- Introduction
- Creating LTI Models
- LTI Properties
- Model Conversion
- Time Delays
- Simulink Block for LTI Systems
- References
- Operations on LTI Models
- Arrays of LTI Models
- Model Analysis Tools
- The LTI Viewer
- Introduction
- Getting Started Using the LTI Viewer: An Example
- The LTI Viewer Menus
- The Right-Click Menus
- The LTI Viewer Tools Menu
- Simulink LTI Viewer
- Control Design Tools
- The Root Locus Design GUI
- Introduction
- A Servomechanism Example
- Controller Design Using the Root Locus Design GUI
- Additional Root Locus Design GUI Features
- References
- Design Case Studies
- Reliable Computations
- Reference
- Category Tables
- acker
- append
- augstate
- balreal
- bode
- c2d
- canon
- care
- chgunits
- connect
- covar
- ctrb
- ctrbf
- d2c
- d2d
- damp
- dare
- dcgain
- delay2z
- dlqr
- dlyap
- drmodel, drss
- dsort
- dss
- dssdata
- esort
- estim
- evalfr
- feedback
- filt
- frd
- frdata
- freqresp
- gensig
- get
- gram
- hasdelay
- impulse
- initial
- inv
- isct, isdt
- isempty
- isproper
- issiso
- kalman
- kalmd
- lft
- lqgreg
- lqr
- lqrd
- lqry
- lsim
- ltiview
- lyap
- margin
- minreal
- modred
- ndims
- ngrid
- nichols
- norm
- nyquist
- obsv
- obsvf
- ord2
- pade
- parallel
- place
- pole
- pzmap
- reg
- reshape
- rlocfind
- rlocus
- rltool
- rmodel, rss
- series
- set
- sgrid
- sigma
- size
- sminreal
- ss
- ss2ss
- ssbal
- ssdata
- stack
- step
- tf
- tfdata
- totaldelay
- zero
- zgrid
- zpk
- zpkdata
- Index
6 The LTI Viewer
6-12
Note: A given LT I Viewer c an only be used to analyze m odels with the same
number of inputs and outputs. If you want to a nalyze models with different
numbers of inputs or outputs, you must import these into separate LTI
Viewers. See “Opening a New LTI Viewer” on page 6-16 for more information.
Zooming
Withthree modelsloaded intot he LTI Viewer, youmay want to zoomin on one
region of a given plot, in order to inspect the response behavior in that region
more closely. For example, let’s zoom in on the step responses of these three
models in the vicinity of 4.5 seconds on the time axis.
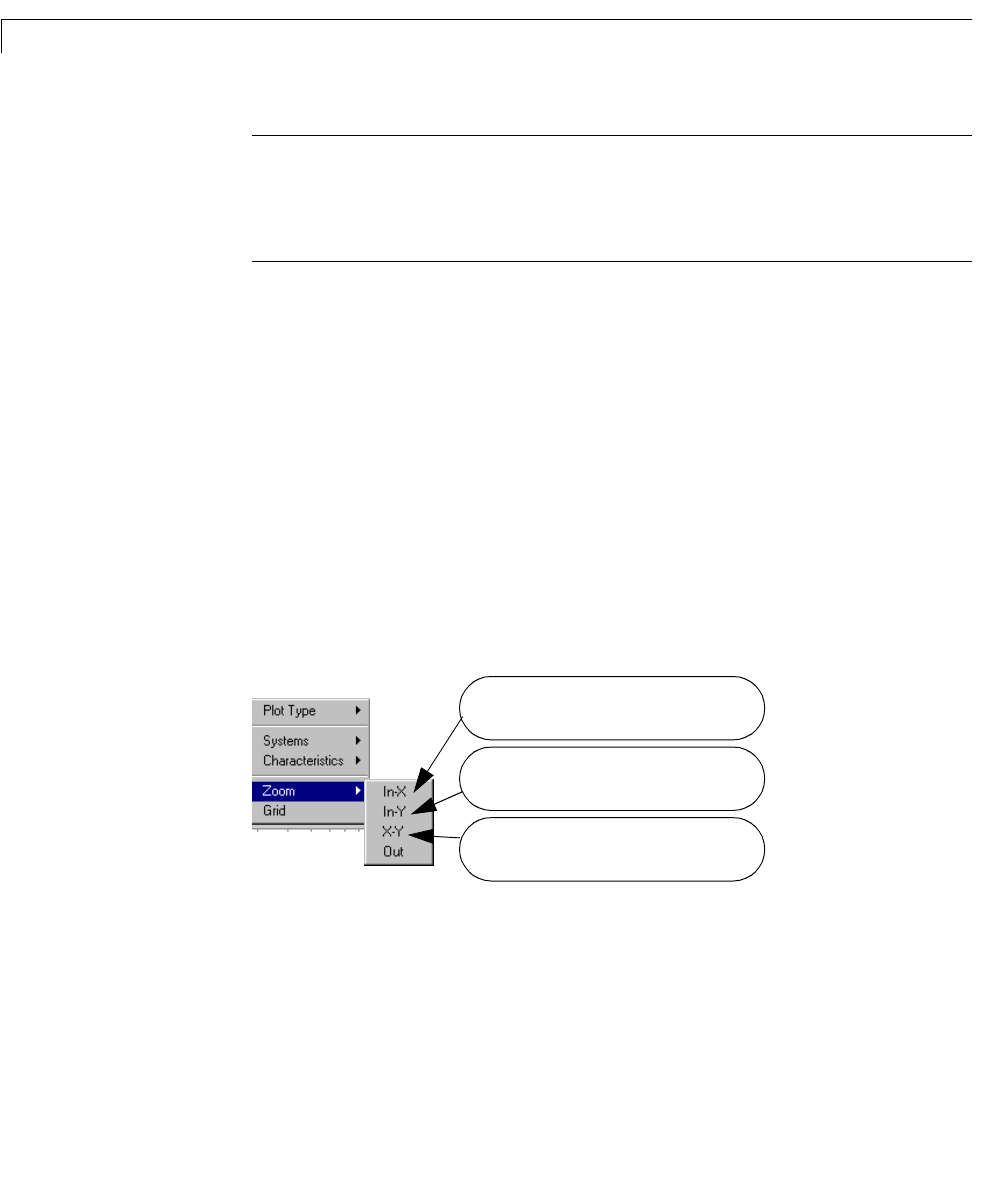
To zoom in on a region on any of the plots, use the
Zoom menu item available
from the right-click menu:
1 Right-click on a plot region (in this case, the step response) to open the
right-click menu.
2 Move your mouse pointer over the Zoom menu.
Your menu looks lik e this.
3 Select X-Y to zoom in both the horizontal and vertical directions.
4 Use you r m ous e to create the rectang ular rubberband that indi cate s the
zoom region:
Select In-X and a horizontal rubber band is
available to select the zoom region.
Select In-Y and a vertical rubber band is
available to select the zoom region.
Select X-Y and a rectangular rubber band is
available to select the zoom region.