
User`s guide
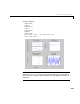


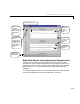
Table Of Contents
- Preface
- Quick Start
- LTI Models
- Introduction
- Creating LTI Models
- LTI Properties
- Model Conversion
- Time Delays
- Simulink Block for LTI Systems
- References
- Operations on LTI Models
- Arrays of LTI Models
- Model Analysis Tools
- The LTI Viewer
- Introduction
- Getting Started Using the LTI Viewer: An Example
- The LTI Viewer Menus
- The Right-Click Menus
- The LTI Viewer Tools Menu
- Simulink LTI Viewer
- Control Design Tools
- The Root Locus Design GUI
- Introduction
- A Servomechanism Example
- Controller Design Using the Root Locus Design GUI
- Additional Root Locus Design GUI Features
- References
- Design Case Studies
- Reliable Computations
- Reference
- Category Tables
- acker
- append
- augstate
- balreal
- bode
- c2d
- canon
- care
- chgunits
- connect
- covar
- ctrb
- ctrbf
- d2c
- d2d
- damp
- dare
- dcgain
- delay2z
- dlqr
- dlyap
- drmodel, drss
- dsort
- dss
- dssdata
- esort
- estim
- evalfr
- feedback
- filt
- frd
- frdata
- freqresp
- gensig
- get
- gram
- hasdelay
- impulse
- initial
- inv
- isct, isdt
- isempty
- isproper
- issiso
- kalman
- kalmd
- lft
- lqgreg
- lqr
- lqrd
- lqry
- lsim
- ltiview
- lyap
- margin
- minreal
- modred
- ndims
- ngrid
- nichols
- norm
- nyquist
- obsv
- obsvf
- ord2
- pade
- parallel
- place
- pole
- pzmap
- reg
- reshape
- rlocfind
- rlocus
- rltool
- rmodel, rss
- series
- set
- sgrid
- sigma
- size
- sminreal
- ss
- ss2ss
- ssbal
- ssdata
- stack
- step
- tf
- tfdata
- totaldelay
- zero
- zgrid
- zpk
- zpkdata
- Index

6 The LTI Viewer
6-2
Introduction
The LTI Viewer is a graphical user interface for viewing and manipulating the
response plots of LTI models.
You can display the following plot types for LTI models using the LTI Viewer:
• Step response (only for TF, SS, or ZPK models)
• Impulse response (only for TF, SS, or ZPK models)
• Bode plot
• Nyquist plot
• Nichols chart
• Singular values of the frequency response
• Poles and zeros (only for TF, SS, or ZPK models)
• LTI model response to a general input (only for TF, SS, or ZPK models)
• Initial state LTI response (only for SS models)
The LTI Viewer displays up to six of these different response analysis plot
types simultaneously. You can also analyze the response plots of several LTI
models at once. However, in order to analyze models with different numbers of
inputs and outputs, you must display them in separate LTI Viewers.
A special version of the LTI Viewer can also be used to analyze Simulink
models. The operation of the Simulink LTI Viewer is discussed at the end of
this chapter in “Simulink LTI Viewer” on page 6-48.
Functionality of the LTI Viewer
The basic function of the LTI Viewer is to display the plots of LTI model
responses.Severalmenusareincludedforoperationssuchasimportingmodels
into the LTI Viewer or printing response plots. In addition to these data
operations,you can manipulatethe LTI Viewer response plotsi n several ways,
including:
• Change the type of plot being displayed in each plot region of the LTI Viewer
• Toggle on and off the response plots of individual LTI models loaded in the
LTI Viewer
• Display response plot characteristics for a given plot type, such as settling
time for a step response plot