
User`s guide
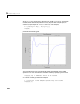
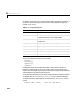
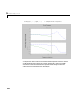
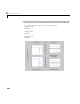
Table Of Contents
- Preface
- Quick Start
- LTI Models
- Introduction
- Creating LTI Models
- LTI Properties
- Model Conversion
- Time Delays
- Simulink Block for LTI Systems
- References
- Operations on LTI Models
- Arrays of LTI Models
- Model Analysis Tools
- The LTI Viewer
- Introduction
- Getting Started Using the LTI Viewer: An Example
- The LTI Viewer Menus
- The Right-Click Menus
- The LTI Viewer Tools Menu
- Simulink LTI Viewer
- Control Design Tools
- The Root Locus Design GUI
- Introduction
- A Servomechanism Example
- Controller Design Using the Root Locus Design GUI
- Additional Root Locus Design GUI Features
- References
- Design Case Studies
- Reliable Computations
- Reference
- Category Tables
- acker
- append
- augstate
- balreal
- bode
- c2d
- canon
- care
- chgunits
- connect
- covar
- ctrb
- ctrbf
- d2c
- d2d
- damp
- dare
- dcgain
- delay2z
- dlqr
- dlyap
- drmodel, drss
- dsort
- dss
- dssdata
- esort
- estim
- evalfr
- feedback
- filt
- frd
- frdata
- freqresp
- gensig
- get
- gram
- hasdelay
- impulse
- initial
- inv
- isct, isdt
- isempty
- isproper
- issiso
- kalman
- kalmd
- lft
- lqgreg
- lqr
- lqrd
- lqry
- lsim
- ltiview
- lyap
- margin
- minreal
- modred
- ndims
- ngrid
- nichols
- norm
- nyquist
- obsv
- obsvf
- ord2
- pade
- parallel
- place
- pole
- pzmap
- reg
- reshape
- rlocfind
- rlocus
- rltool
- rmodel, rss
- series
- set
- sgrid
- sigma
- size
- sminreal
- ss
- ss2ss
- ssbal
- ssdata
- stack
- step
- tf
- tfdata
- totaldelay
- zero
- zgrid
- zpk
- zpkdata
- Index

5 Model Analysis Tools
5-12
In addition, the function margin determines the gain and phase margins for a
given SISO open-loop model. These functions can be applied to single LTI
models or LTI arrays.
As for time response functions, the commands
bode(sys)
nichols(sys)
nyquist(sys)
sigma(sys)
handle both continuous and discrete models. These functions produce a
frequency response plot for SISO LTI models, and an array of plots in the
MIMO case. The frequency grid used to evaluate the response is automatically
selected based on the system poles and z eros.
TheBodeplotproducedby
bode plots the magnitude of the frequency response
in decibels (dB), as
20*log10(abs(response)). Phase is plotted in degrees.
To set the frequency range explicitly to some interval
[wmin,wmax],usethe
syntax
bode(sys,{wmin , wmax}) % Note the curly braces
Table 5-1: Frequency Response
Function Name Description
bode
ComputestheBodeplot.
evalfr
Computes t he frequency response at a single
complex frequency (not for FRD models).
freqresp
Computes the frequency response for a set of
frequencies.
margin
Computes gain a nd phase margins.
ngrid
Applies grid lines to a Nichols plot.
nichols
Computes the Nichols plot.
nyquist
Computes the Nyquist plot.
sigma
Computes the singular v alue plot.