
Specifications

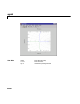
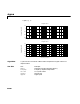
Table Of Contents
- Introduction
- LTI Models
- Operations on LTI Models
- Model Analysis Tools
- Arrays of LTI Models
- Customization
- Setting Toolbox Preferences
- Setting Tool Preferences
- Customizing Response Plot Properties
- Design Case Studies
- Reliable Computations
- GUI Reference
- SISO Design Tool Reference
- Menu Bar
- File
- Import
- Export
- Toolbox Preferences
- Print to Figure
- Close
- Edit
- Undo and Redo
- Root Locus and Bode Diagrams
- SISO Tool Preferences
- View
- Root Locus and Bode Diagrams
- System Data
- Closed Loop Poles
- Design History
- Tools
- Loop Responses
- Continuous/Discrete Conversions
- Draw a Simulink Diagram
- Compensator
- Format
- Edit
- Store
- Retrieve
- Clear
- Window
- Help
- Tool Bar
- Current Compensator
- Feedback Structure
- Root Locus Right-Click Menus
- Bode Diagram Right-Click Menus
- Status Panel
- Menu Bar
- LTI Viewer Reference
- Right-Click Menus for Response Plots
- Function Reference
- Functions by Category
- acker
- allmargin
- append
- augstate
- balreal
- bode
- bodemag
- c2d
- canon
- care
- chgunits
- connect
- covar
- ctrb
- ctrbf
- d2c
- d2d
- damp
- dare
- dcgain
- delay2z
- dlqr
- dlyap
- drss
- dsort
- dss
- dssdata
- esort
- estim
- evalfr
- feedback
- filt
- frd
- frdata
- freqresp
- gensig
- get
- gram
- hasdelay
- impulse
- initial
- interp
- inv
- isct, isdt
- isempty
- isproper
- issiso
- kalman
- kalmd
- lft
- lqgreg
- lqr
- lqrd
- lqry
- lsim
- ltimodels
- ltiprops
- ltiview
- lyap
- margin
- minreal
- modred
- ndims
- ngrid
- nichols
- norm
- nyquist
- obsv
- obsvf
- ord2
- pade
- parallel
- place
- pole
- pzmap
- reg
- reshape
- rlocus
- rss
- series
- set
- sgrid
- sigma
- sisotool
- size
- sminreal
- ss
- ss2ss
- ssbal
- ssdata
- stack
- step
- tf
- tfdata
- totaldelay
- zero
- zgrid
- zpk
- zpkdata
- Index

sigma
16-195
16sigma
Purpose Singular values of the frequency response of LTI models
Syntax sigma(sys)
sigma(sys,w)
sigma(sys,w,type)
sigma(sys1,sys2,...,sysN)
sigma(sys1,sys2,...,sysN,w)
sigma(sys1,sys2,...,sysN,w,type)
sigma(sys1,'PlotStyle1',...,sysN,'PlotStyleN')
[sv,w] = sigma(sys)
sv = sigma(sys,w)
Description sigma calculatesthesingular values of thefrequency responseofanLTImodel.
For an FRD model,
sys, sigma computes the singular values of sys.Response
at thefrequencies, sys.frequency.Forcontinuous-timeTF,SS,or ZPKmodels
with transfer function ,
sigma computes the singular values of as
a function of the frequency . For discrete-time TF, SS, or ZPK models with
transfer function and sample time ,
sigma computes the singular
values of
for frequencies between 0 and the Nyquist frequency .
The singular values of the frequency response extend the Bode magnitude
response for MIMO systems and are useful in robustness analysis. The
singular value response of a SISO system is identical to its Bode magnitude
response.When invokedwithoutoutputarguments,
sigma produces asingular
value plot on the screen.
sigma(sys) plots the singular values of the frequency response of an arbitrary
LTI model
sys. This model can be continuous or discrete, and SISO or MIMO.
The frequency points are chosen automatically based on the system poles and
zeros, or from
sys.frequency if sys is an FRD.
sigma(sys,w) explicitlyspecifiesthefrequencyrange orfrequency pointsto be
used for the plot. To focus on a particular frequency interval
[wmin,wmax],set
Hs
()
Hj
ω()
ω
Hz
()
T
s
He
j
ω
T
s
()
ωω
N
π
T
s
⁄
=