
Specifications

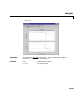
Table Of Contents
- Introduction
- LTI Models
- Operations on LTI Models
- Model Analysis Tools
- Arrays of LTI Models
- Customization
- Setting Toolbox Preferences
- Setting Tool Preferences
- Customizing Response Plot Properties
- Design Case Studies
- Reliable Computations
- GUI Reference
- SISO Design Tool Reference
- Menu Bar
- File
- Import
- Export
- Toolbox Preferences
- Print to Figure
- Close
- Edit
- Undo and Redo
- Root Locus and Bode Diagrams
- SISO Tool Preferences
- View
- Root Locus and Bode Diagrams
- System Data
- Closed Loop Poles
- Design History
- Tools
- Loop Responses
- Continuous/Discrete Conversions
- Draw a Simulink Diagram
- Compensator
- Format
- Edit
- Store
- Retrieve
- Clear
- Window
- Help
- Tool Bar
- Current Compensator
- Feedback Structure
- Root Locus Right-Click Menus
- Bode Diagram Right-Click Menus
- Status Panel
- Menu Bar
- LTI Viewer Reference
- Right-Click Menus for Response Plots
- Function Reference
- Functions by Category
- acker
- allmargin
- append
- augstate
- balreal
- bode
- bodemag
- c2d
- canon
- care
- chgunits
- connect
- covar
- ctrb
- ctrbf
- d2c
- d2d
- damp
- dare
- dcgain
- delay2z
- dlqr
- dlyap
- drss
- dsort
- dss
- dssdata
- esort
- estim
- evalfr
- feedback
- filt
- frd
- frdata
- freqresp
- gensig
- get
- gram
- hasdelay
- impulse
- initial
- interp
- inv
- isct, isdt
- isempty
- isproper
- issiso
- kalman
- kalmd
- lft
- lqgreg
- lqr
- lqrd
- lqry
- lsim
- ltimodels
- ltiprops
- ltiview
- lyap
- margin
- minreal
- modred
- ndims
- ngrid
- nichols
- norm
- nyquist
- obsv
- obsvf
- ord2
- pade
- parallel
- place
- pole
- pzmap
- reg
- reshape
- rlocus
- rss
- series
- set
- sgrid
- sigma
- sisotool
- size
- sminreal
- ss
- ss2ss
- ssbal
- ssdata
- stack
- step
- tf
- tfdata
- totaldelay
- zero
- zgrid
- zpk
- zpkdata
- Index

margin
16-137
16margin
Purpose Compute gain and phase margins and associated crossover frequencies
Syntax [Gm,Pm,Wcg,Wcp] = margin(sys)
[Gm,Pm,Wcg,Wcp] = margin(mag,phase,w)
margin(sys)
Description margin calculates the minimum gain margin, phase margin, and associated
crossover frequencies of SISO open-loop models. The gain and phase margins
indicate the relative stability of the control system when the loop is closed.
When invoked without left-hand arguments,
margin produces a Bode plot and
displays the margins on this plot.
The gain margin is the amount of gain increase required to make the loop gain
unity at the frequency where the phase angle is –180°. In other words, the gain
margin is if is the gain at the –180° phase frequency. Similarly, the
phase margin is the difference between the phase of the response and –180°
when theloop gain is 1.0. The frequency at which themagnitude is 1.0 iscalled
the unity-gain frequency or crossover frequency.Itis generally found that gain
margins of three or more combined with phase margins between 30 and 60
degrees result in reasonable trade-offs between bandwidth and stability.
[Gm,Pm,Wcg,Wcp] = margin(sys) computes the gain margin Gm,thephase
margin
Pm, and the correspondingcrossover frequencies Wcg andWcp,giventhe
SISO open-loop model
sys. This function handles both continuous- and
discrete-time cases. When faced with several crossover frequencies,
margin
returns the smallest gain and phase margins.
[Gm,Pm,Wcg,Wcp] = margin(mag,phase,w) derives the gain and phase
margins from the Bode frequency response data (magnitude, phase, and
frequency vector). Interpolation is performed between the frequency points to
estimate the margin values. This approach is generally less accurate.
When invoked without left-hand argument,
margin(sys)
plots the open-loop Bode response with the gain and phase margins marked by
vertical lines.
1 g
⁄
g