
Specifications
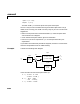
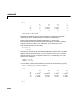
Table Of Contents
- Introduction
- LTI Models
- Operations on LTI Models
- Model Analysis Tools
- Arrays of LTI Models
- Customization
- Setting Toolbox Preferences
- Setting Tool Preferences
- Customizing Response Plot Properties
- Design Case Studies
- Reliable Computations
- GUI Reference
- SISO Design Tool Reference
- Menu Bar
- File
- Import
- Export
- Toolbox Preferences
- Print to Figure
- Close
- Edit
- Undo and Redo
- Root Locus and Bode Diagrams
- SISO Tool Preferences
- View
- Root Locus and Bode Diagrams
- System Data
- Closed Loop Poles
- Design History
- Tools
- Loop Responses
- Continuous/Discrete Conversions
- Draw a Simulink Diagram
- Compensator
- Format
- Edit
- Store
- Retrieve
- Clear
- Window
- Help
- Tool Bar
- Current Compensator
- Feedback Structure
- Root Locus Right-Click Menus
- Bode Diagram Right-Click Menus
- Status Panel
- Menu Bar
- LTI Viewer Reference
- Right-Click Menus for Response Plots
- Function Reference
- Functions by Category
- acker
- allmargin
- append
- augstate
- balreal
- bode
- bodemag
- c2d
- canon
- care
- chgunits
- connect
- covar
- ctrb
- ctrbf
- d2c
- d2d
- damp
- dare
- dcgain
- delay2z
- dlqr
- dlyap
- drss
- dsort
- dss
- dssdata
- esort
- estim
- evalfr
- feedback
- filt
- frd
- frdata
- freqresp
- gensig
- get
- gram
- hasdelay
- impulse
- initial
- interp
- inv
- isct, isdt
- isempty
- isproper
- issiso
- kalman
- kalmd
- lft
- lqgreg
- lqr
- lqrd
- lqry
- lsim
- ltimodels
- ltiprops
- ltiview
- lyap
- margin
- minreal
- modred
- ndims
- ngrid
- nichols
- norm
- nyquist
- obsv
- obsvf
- ord2
- pade
- parallel
- place
- pole
- pzmap
- reg
- reshape
- rlocus
- rss
- series
- set
- sgrid
- sigma
- sisotool
- size
- sminreal
- ss
- ss2ss
- ssbal
- ssdata
- stack
- step
- tf
- tfdata
- totaldelay
- zero
- zgrid
- zpk
- zpkdata
- Index

connect
16-37
16connect
Purpose Derive state-space model from block diagram description
Syntax sysc = connect(sys,Q,inputs,outputs)
Description Complex dynamical systems are often given in block diagram form. For
systems of even moderate complexity, it can be quite difficult to find the
state-space model required in order to bring certain analysis and design tools
into use. Starting with a block diagram description, you can use
append and
connect to construct a state-space model of the system.
First, use
sys = append(sys1,sys2,...,sysN)
to specify each block sysj in the diagram and form a block-diagonal,
unconnected LTI model
sys of the diagram.
Next, use
sysc = connect(sys,Q,inputs,outputs)
to connect the blocks together and derive a state-space model sysc for the
overall interconnection. The arguments
Q, inputs,andoutputs have the
following purpose:
• The matrix
Q indicates how the blocks on the diagram are connected. It has
a row for each input of
sys, where the first element of each row is the input
number. The subsequent elements of each row specify where the block input
gets its summing inputs; negative elements indicate minus inputs to the
summingjunction. Forexample,if input 7 gets its inputs from the outputs 2,
15, and 6, where the input from output15 is negative, the corresponding row
of
Q is [7 2 -15 6]. Short rows can be padded with trailing zeros (see
example below).
• Given
sys and Q, connect computes a state-space model of the
interconnection with the same inputs and outputs as
sys (that is, the
concatenation of all block inputs and outputs).The index vectors
inputs and
outputs then indicate which of the inputs and outputs in the large
unconnected system are external inputs and outputs of the block diagram.
For example, if the external inputs are inputs 1, 2, and 15 of
sys,andthe
external outputs are outputs 2 and7 of
sys,theninputs and outputs should
be set to