
Specifications

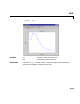
Table Of Contents
- Introduction
- LTI Models
- Operations on LTI Models
- Model Analysis Tools
- Arrays of LTI Models
- Customization
- Setting Toolbox Preferences
- Setting Tool Preferences
- Customizing Response Plot Properties
- Design Case Studies
- Reliable Computations
- GUI Reference
- SISO Design Tool Reference
- Menu Bar
- File
- Import
- Export
- Toolbox Preferences
- Print to Figure
- Close
- Edit
- Undo and Redo
- Root Locus and Bode Diagrams
- SISO Tool Preferences
- View
- Root Locus and Bode Diagrams
- System Data
- Closed Loop Poles
- Design History
- Tools
- Loop Responses
- Continuous/Discrete Conversions
- Draw a Simulink Diagram
- Compensator
- Format
- Edit
- Store
- Retrieve
- Clear
- Window
- Help
- Tool Bar
- Current Compensator
- Feedback Structure
- Root Locus Right-Click Menus
- Bode Diagram Right-Click Menus
- Status Panel
- Menu Bar
- LTI Viewer Reference
- Right-Click Menus for Response Plots
- Function Reference
- Functions by Category
- acker
- allmargin
- append
- augstate
- balreal
- bode
- bodemag
- c2d
- canon
- care
- chgunits
- connect
- covar
- ctrb
- ctrbf
- d2c
- d2d
- damp
- dare
- dcgain
- delay2z
- dlqr
- dlyap
- drss
- dsort
- dss
- dssdata
- esort
- estim
- evalfr
- feedback
- filt
- frd
- frdata
- freqresp
- gensig
- get
- gram
- hasdelay
- impulse
- initial
- interp
- inv
- isct, isdt
- isempty
- isproper
- issiso
- kalman
- kalmd
- lft
- lqgreg
- lqr
- lqrd
- lqry
- lsim
- ltimodels
- ltiprops
- ltiview
- lyap
- margin
- minreal
- modred
- ndims
- ngrid
- nichols
- norm
- nyquist
- obsv
- obsvf
- ord2
- pade
- parallel
- place
- pole
- pzmap
- reg
- reshape
- rlocus
- rss
- series
- set
- sgrid
- sigma
- sisotool
- size
- sminreal
- ss
- ss2ss
- ssbal
- ssdata
- stack
- step
- tf
- tfdata
- totaldelay
- zero
- zgrid
- zpk
- zpkdata
- Index

bodemag
16-26
16bodemag
Purpose Compute the Bode magnitude response of LTI models
Syntax bodemag(sys)
bodemag(sys,{wmin,wmax})
bodemag(sys,w)
bodemag(sys1,sys2,...,sysN,w)
bodemag(sys1,'PlotStyle1',...,sysN,'PlotStyleN')
Description bodemag(sys) plots the magnitude of the frequency response of the LTI model
SYS (Bode plot without the phase diagram). The frequency range and number
of points are chosen automatically.
bodemag(sys,{wmin,wmax}) drawsthemagnitudeplotfor frequenciesbetween
wmin and wmax (in radians/second).
bodemag(sys,w) uses the user-supplied vector W of frequencies, in
radians/second, at which the frequency response is to be evaluated.
bodemag(sys1,sys2,...,sysN,w) shows the frequencyresponse magnitude of
several LTI models
sys1,sys2,...,sysN on a single plot. The frequency vector
w is optional. You canalso specify a color, line style, and marker for eachmodel,
as in
bodemag(sys1,'r',sys2,'y--',sys3,'gx').
See Also bode Compute the Bode frequency response of LTI models
ltiview Open an LTI Viewer
ltimodels Help on LTI models