
Specifications

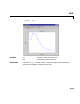
Table Of Contents
- Introduction
- LTI Models
- Operations on LTI Models
- Model Analysis Tools
- Arrays of LTI Models
- Customization
- Setting Toolbox Preferences
- Setting Tool Preferences
- Customizing Response Plot Properties
- Design Case Studies
- Reliable Computations
- GUI Reference
- SISO Design Tool Reference
- Menu Bar
- File
- Import
- Export
- Toolbox Preferences
- Print to Figure
- Close
- Edit
- Undo and Redo
- Root Locus and Bode Diagrams
- SISO Tool Preferences
- View
- Root Locus and Bode Diagrams
- System Data
- Closed Loop Poles
- Design History
- Tools
- Loop Responses
- Continuous/Discrete Conversions
- Draw a Simulink Diagram
- Compensator
- Format
- Edit
- Store
- Retrieve
- Clear
- Window
- Help
- Tool Bar
- Current Compensator
- Feedback Structure
- Root Locus Right-Click Menus
- Bode Diagram Right-Click Menus
- Status Panel
- Menu Bar
- LTI Viewer Reference
- Right-Click Menus for Response Plots
- Function Reference
- Functions by Category
- acker
- allmargin
- append
- augstate
- balreal
- bode
- bodemag
- c2d
- canon
- care
- chgunits
- connect
- covar
- ctrb
- ctrbf
- d2c
- d2d
- damp
- dare
- dcgain
- delay2z
- dlqr
- dlyap
- drss
- dsort
- dss
- dssdata
- esort
- estim
- evalfr
- feedback
- filt
- frd
- frdata
- freqresp
- gensig
- get
- gram
- hasdelay
- impulse
- initial
- interp
- inv
- isct, isdt
- isempty
- isproper
- issiso
- kalman
- kalmd
- lft
- lqgreg
- lqr
- lqrd
- lqry
- lsim
- ltimodels
- ltiprops
- ltiview
- lyap
- margin
- minreal
- modred
- ndims
- ngrid
- nichols
- norm
- nyquist
- obsv
- obsvf
- ord2
- pade
- parallel
- place
- pole
- pzmap
- reg
- reshape
- rlocus
- rss
- series
- set
- sgrid
- sigma
- sisotool
- size
- sminreal
- ss
- ss2ss
- ssbal
- ssdata
- stack
- step
- tf
- tfdata
- totaldelay
- zero
- zgrid
- zpk
- zpkdata
- Index

bode
16-21
16bode
Purpose Compute the Bode frequency response of LTI models
Syntax bode(sys)
bode(sys,w)
bode(sys1,sys2,...,sysN)
bode(sys1,sys2,...,sysN,w)
bode(sys1,'PlotStyle1',...,sysN,'PlotStyleN')
[mag,phase,w] = bode(sys)
Description bode computes the magnitude and phase of the frequency response of LTI
models.Wheninvokedwithoutleft-handarguments,
bode produces aBodeplot
on the screen. The magnitude is plotted in decibels (dB), and the phase in
degrees. The decibel calculation for
mag is computed as 20log
10
,
where is the system’s frequency response. Bode plots are used to
analyze system properties such as the gain margin, phase margin, DC gain,
bandwidth, disturbance rejection, and stability.
bode(sys) plots the Bode response of an arbitrary LTI model sys.Thismodel
can be continuous or discrete, and SISO or MIMO. In the MIMO case,
bode
produces an array of Bode plots, each plot showing the Bode response of one
particularI/Ochannel.Thefrequencyrange isdeterminedautomatically based
on the system poles and zeros.
bode(sys,w) explicitly specifies the frequency range or frequency points to be
used for the plot. To focus on a particular frequency interval
[wmin,wmax],set
w = {wmin,wmax}. To use particular frequency points, set w to the vector of
desired frequencies.
Use logspace to generate logarithmically spaced
frequency vectors. All frequencies should be specified in radians/sec.
bode(sys1,sys2,...,sysN) or bode(sys1,sys2,...,sysN,w) plots the Bode
responses of several LTI models on a single figure. All systems must have the
same number of inputs and outputs, but may otherwise be a mix of continuous
and discrete systems. This syntax is useful to compare the Bode responses of
multiple systems.
bode(sys1,'PlotStyle1',...,sysN,'PlotStyleN') specifies which color,
linestyle, and/or marker should be used to plot each system. For example,
bode(sys1,'r--',sys2,'gx')
Hj
ω()()
Hj
ω()