
Specifications


Table Of Contents
- Introduction
- LTI Models
- Operations on LTI Models
- Model Analysis Tools
- Arrays of LTI Models
- Customization
- Setting Toolbox Preferences
- Setting Tool Preferences
- Customizing Response Plot Properties
- Design Case Studies
- Reliable Computations
- GUI Reference
- SISO Design Tool Reference
- Menu Bar
- File
- Import
- Export
- Toolbox Preferences
- Print to Figure
- Close
- Edit
- Undo and Redo
- Root Locus and Bode Diagrams
- SISO Tool Preferences
- View
- Root Locus and Bode Diagrams
- System Data
- Closed Loop Poles
- Design History
- Tools
- Loop Responses
- Continuous/Discrete Conversions
- Draw a Simulink Diagram
- Compensator
- Format
- Edit
- Store
- Retrieve
- Clear
- Window
- Help
- Tool Bar
- Current Compensator
- Feedback Structure
- Root Locus Right-Click Menus
- Bode Diagram Right-Click Menus
- Status Panel
- Menu Bar
- LTI Viewer Reference
- Right-Click Menus for Response Plots
- Function Reference
- Functions by Category
- acker
- allmargin
- append
- augstate
- balreal
- bode
- bodemag
- c2d
- canon
- care
- chgunits
- connect
- covar
- ctrb
- ctrbf
- d2c
- d2d
- damp
- dare
- dcgain
- delay2z
- dlqr
- dlyap
- drss
- dsort
- dss
- dssdata
- esort
- estim
- evalfr
- feedback
- filt
- frd
- frdata
- freqresp
- gensig
- get
- gram
- hasdelay
- impulse
- initial
- interp
- inv
- isct, isdt
- isempty
- isproper
- issiso
- kalman
- kalmd
- lft
- lqgreg
- lqr
- lqrd
- lqry
- lsim
- ltimodels
- ltiprops
- ltiview
- lyap
- margin
- minreal
- modred
- ndims
- ngrid
- nichols
- norm
- nyquist
- obsv
- obsvf
- ord2
- pade
- parallel
- place
- pole
- pzmap
- reg
- reshape
- rlocus
- rss
- series
- set
- sgrid
- sigma
- sisotool
- size
- sminreal
- ss
- ss2ss
- ssbal
- ssdata
- stack
- step
- tf
- tfdata
- totaldelay
- zero
- zgrid
- zpk
- zpkdata
- Index
Right-Click Menus for MIMO and LTI Arrays
15-9
•None — By default,thereisnoaxisgrouping.Forexample,ifyoudisplaythe
step responses for a 3-input, 2- output system, there will be six plots in your
window.
•
All — Groups all the responses into a single plot
•
Inputs — Groups all the responses by inputs. For example, for a 3-input,
2-outputsystem, selectingInputsreconfigures the viewer so that there are 3
plots. Each plot contains two curves.
•
Outputs — Groups all the responses by outputs. For example, for a 3-input,
2-outputsystem, selectingInputsreconfigures the viewer so that there are 2
plots. Each plot contains three curves.
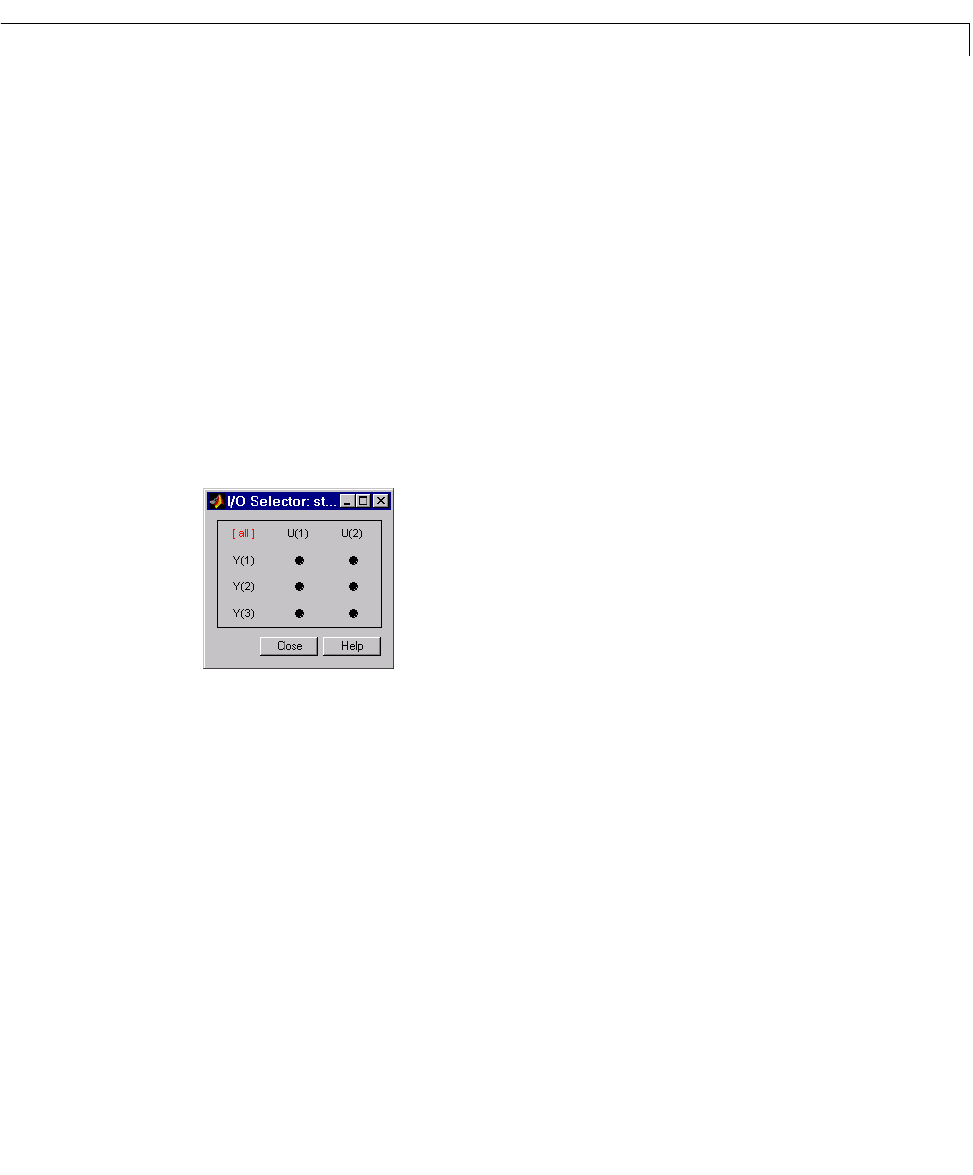
I/O Selector
I/O Selector opens the I/O Selector window, shown below.
The
I/O Selector window contains buttons corresponding to each I/O pair. In
this example, there are 2 inputs and 3 outputs, so there are six buttons. By
default, all the I/O pairs are selected. If you click on a button, that I/O pair
alone is displayed in the plot window. The other buttons automatically
deselect.
To select a column of inputs, click on the input name above the column. The
names are
U(1), U(2), and so on. The plot window displays the responses from
the specified input to all the outputs.
To select a row of output, click on the output name to the left of the row. The
names are
Y(1), Y(2), and so on. The plot window displays the responses from
all the inputs to the specified output.
To reestablish the default setting, click
[all]. The plot window displays all the
I/O pairs.