
Specifications
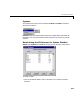
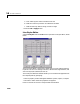
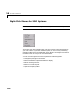
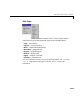
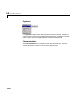

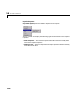
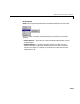
Table Of Contents
- Introduction
- LTI Models
- Operations on LTI Models
- Model Analysis Tools
- Arrays of LTI Models
- Customization
- Setting Toolbox Preferences
- Setting Tool Preferences
- Customizing Response Plot Properties
- Design Case Studies
- Reliable Computations
- GUI Reference
- SISO Design Tool Reference
- Menu Bar
- File
- Import
- Export
- Toolbox Preferences
- Print to Figure
- Close
- Edit
- Undo and Redo
- Root Locus and Bode Diagrams
- SISO Tool Preferences
- View
- Root Locus and Bode Diagrams
- System Data
- Closed Loop Poles
- Design History
- Tools
- Loop Responses
- Continuous/Discrete Conversions
- Draw a Simulink Diagram
- Compensator
- Format
- Edit
- Store
- Retrieve
- Clear
- Window
- Help
- Tool Bar
- Current Compensator
- Feedback Structure
- Root Locus Right-Click Menus
- Bode Diagram Right-Click Menus
- Status Panel
- Menu Bar
- LTI Viewer Reference
- Right-Click Menus for Response Plots
- Function Reference
- Functions by Category
- acker
- allmargin
- append
- augstate
- balreal
- bode
- bodemag
- c2d
- canon
- care
- chgunits
- connect
- covar
- ctrb
- ctrbf
- d2c
- d2d
- damp
- dare
- dcgain
- delay2z
- dlqr
- dlyap
- drss
- dsort
- dss
- dssdata
- esort
- estim
- evalfr
- feedback
- filt
- frd
- frdata
- freqresp
- gensig
- get
- gram
- hasdelay
- impulse
- initial
- interp
- inv
- isct, isdt
- isempty
- isproper
- issiso
- kalman
- kalmd
- lft
- lqgreg
- lqr
- lqrd
- lqry
- lsim
- ltimodels
- ltiprops
- ltiview
- lyap
- margin
- minreal
- modred
- ndims
- ngrid
- nichols
- norm
- nyquist
- obsv
- obsvf
- ord2
- pade
- parallel
- place
- pole
- pzmap
- reg
- reshape
- rlocus
- rss
- series
- set
- sgrid
- sigma
- sisotool
- size
- sminreal
- ss
- ss2ss
- ssbal
- ssdata
- stack
- step
- tf
- tfdata
- totaldelay
- zero
- zgrid
- zpk
- zpkdata
- Index

LTI Viewer Menu Bar
14-11
Setting Preferences
You can use the “Distinguish by” matrix to specify the line property that will
vary throughout the response plots. You can group mutliple plot curves by
systems, inputs, outputs, or channels (individual input/output relationships).
Note that the Line Styles editor uses radio buttons, which means that you can
only assign one property setting for each grouping (system, input, etc.).
Ordering Properties
The Order field allows you to change the default property order used when
applying the different line properties. You canreorder the colors, markers, and
linestyles (e.g., solid or dashed).
To change any of thepropertyorders,press the up or down arrow button to the
left of the associated property list to move the selected property up or down in
the list
Viewer Preferences
Viewer Preferences opens the LTI Viewer Preferences editor, which you can
use to set response plot defaults for the LTI Viewer that is currently open.
For a complete description of the LTI Viewer Preference editor, as well as all
the property and preference editors available in the Control System Toolbox,
see Setting Plot Properties and Preferences in the online documentation. To go
directly to the LTI Viewer Preferences editor documentation, see LTI Viewer
Preferences in the same document.
Window
Use the Window menu to select which of your MATLAB windows is active.
This menu lists any window associated with MATLAB and the Control System
Toolbox. The MATLAB Command Window is always listed first.
Help
The Help menu links to this help file.