
Specifications


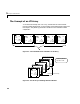
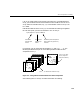
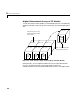
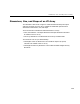

Table Of Contents
- Introduction
- LTI Models
- Operations on LTI Models
- Model Analysis Tools
- Arrays of LTI Models
- Customization
- Setting Toolbox Preferences
- Setting Tool Preferences
- Customizing Response Plot Properties
- Design Case Studies
- Reliable Computations
- GUI Reference
- SISO Design Tool Reference
- Menu Bar
- File
- Import
- Export
- Toolbox Preferences
- Print to Figure
- Close
- Edit
- Undo and Redo
- Root Locus and Bode Diagrams
- SISO Tool Preferences
- View
- Root Locus and Bode Diagrams
- System Data
- Closed Loop Poles
- Design History
- Tools
- Loop Responses
- Continuous/Discrete Conversions
- Draw a Simulink Diagram
- Compensator
- Format
- Edit
- Store
- Retrieve
- Clear
- Window
- Help
- Tool Bar
- Current Compensator
- Feedback Structure
- Root Locus Right-Click Menus
- Bode Diagram Right-Click Menus
- Status Panel
- Menu Bar
- LTI Viewer Reference
- Right-Click Menus for Response Plots
- Function Reference
- Functions by Category
- acker
- allmargin
- append
- augstate
- balreal
- bode
- bodemag
- c2d
- canon
- care
- chgunits
- connect
- covar
- ctrb
- ctrbf
- d2c
- d2d
- damp
- dare
- dcgain
- delay2z
- dlqr
- dlyap
- drss
- dsort
- dss
- dssdata
- esort
- estim
- evalfr
- feedback
- filt
- frd
- frdata
- freqresp
- gensig
- get
- gram
- hasdelay
- impulse
- initial
- interp
- inv
- isct, isdt
- isempty
- isproper
- issiso
- kalman
- kalmd
- lft
- lqgreg
- lqr
- lqrd
- lqry
- lsim
- ltimodels
- ltiprops
- ltiview
- lyap
- margin
- minreal
- modred
- ndims
- ngrid
- nichols
- norm
- nyquist
- obsv
- obsvf
- ord2
- pade
- parallel
- place
- pole
- pzmap
- reg
- reshape
- rlocus
- rss
- series
- set
- sgrid
- sigma
- sisotool
- size
- sminreal
- ss
- ss2ss
- ssbal
- ssdata
- stack
- step
- tf
- tfdata
- totaldelay
- zero
- zgrid
- zpk
- zpkdata
- Index
5 Arrays of LTI Models
5-4
The Concept of an LTI Array
To visualize the concept of an LTI array, consider the set of five transfer
function models shown below. In this example, each model has two inputs and
two outputs. They differ by parameter variations in the individual model
components.
Figure 5-1: Five LTI Models to be Collected in an LTI Array
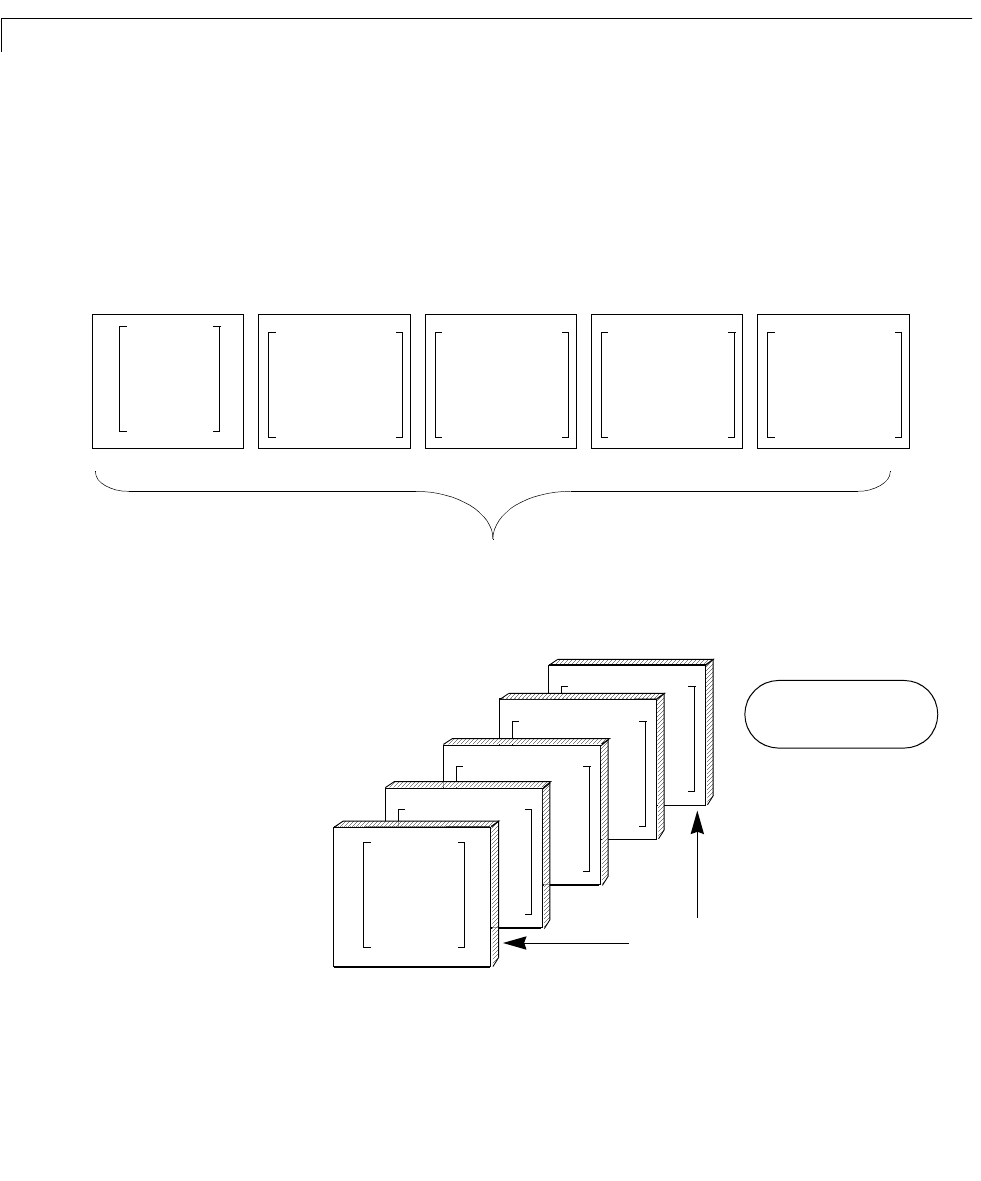
Figure 5-2: An LTI Array Containing These Five Models
1.1
s 1+
------------
0
0
1
s 5+
------------
1.3
s 1.1+
-----------------
0
0
1
s 5.2+
-----------------
1.11
s 1.2+
-----------------
0
0
1
s 5.4+
-----------------
1.15
s 1.3+
-----------------
0
0
1
s 5.6+
-----------------
1.09
s 1.4+
-----------------
0
0
1
s 5.8+
-----------------
1.09
s 1.4+
-----------------
0
0
1
s 5.8+
-----------------
1.15
s 1.3+
-----------------
0
0
1
s 5.6+
-----------------
1.11
s 1.2+
-----------------
0
0
1
s 5.4+
-----------------
1.3
s 1.1+
-----------------
0
0
1
s 5.2+
-----------------
1.1
s 1+
------------
0
0
1
s 5+
------------
Each element of the LTI array
is a model.
This LTI array embodies a
1-by-5 list of models.