
User`s guide


4 Usage Examples
4-32
15 and 40 Hz. Sample the signal for 10 seconds at a sampling rate of 0.01 sec.
Put the time points into column A and the signal points into column B.
Creating the Data
Follow these steps to create the data.
1 Enter 0 for cell A1 in the current worksheet.
2 Click on cell A2 and type the formula "= A1 + 0.01".
3 Click and hold on the lower right hand corner of cell A2 and drag the formula
down the column to cell A1001. This procedure fills the range A1:A1001 with
the interval 0 to 10 incremented by 0.01.
4 Click on cell B1 and type the formula "= SIN(2*PI()*15*A1) +
SIN(2*PI()*40*A1) + RAND()"
. Repeat the drag procedure to copy this
formula to all cells in the range B1:B1001.
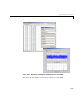
Running the Test
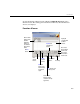
Using the column of data (column B), test the add-in as follows:
1 Select Tools->Spectral Analysis… from the main menu.
2 Click on the Input Data box.
3 Select the B1:B1001 range from the worksheet or type this address into
Input Data.
4 Click on the Sampling Interval box and type 0.01.
5 Check Plot time domain signal and power spectral density.
6 Enter C1:C1001 for frequency output, and likewise enter D1:D1001,
E1:E1001, and F1:F1001 for the FFT real and imaginary parts, and spectral
density.
7 Click OK to run the analysis.
The next figure shows the output.