
User`s guide


Spectral Analysis Example
4-31
2 When the Workbook Properties dialog appears, select the Summary tab
and enter
Spectral Analysis as the workbook title.
3 Click OK to save the edits.
4 Select File->Save As from the Excel main menu.
5 When the Save As dialog appears, select Microsoft Excel Add-In (*.xla) as
the file type, and browse to
<project-directory>\distrib.
6 Enter Fourier.xla as the file name and click Save to save the add-in.
Testing The Add-in
Before distributing the add-in, test it with a sample problem. Spectral analysis
is commonly used to find the frequency components of a signal buried in a noisy
time domain signal. In this example you will create a data representation of a
signal containing two distinct components and add to it a random component.
This data along with the output will be stored in columns of an Excel
worksheet, and you will plot the time-domain signal along with the power
spectral density.
Follow the steps outlined below to create the test problem.
1 Start a new session of Excel with a blank workbook.
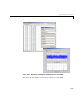
2 Select Tools->Add-Ins from the main menu.
3 When the Add-Ins dialog comes up, click Browse.
4 Browse to the <project-directory>\distrib directory, select Fourier.xla
and click
OK.
5 The Spectral Analysis add-in appears in the available Add-Ins list and is
checked.
6 Click OK to load the add-in.
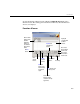
This add-in installs a menu item under the Excel
Tools menu. You can display
the Spectral Analysis GUI by selecting
Tools->Spectral Analysis. Before
invoking the add-in, create some data, in this case a signal with components at