
User`s guide

4 Usage Examples
4-18
Spectral Analysis Example
This example illustrates the creation of a comprehensive Excel add-in to
perform spectral analysis. It requires knowledge of Visual Basic forms and
controls, as well as Excel workbook events. See the VBA documentation for a
complete discussion of these topics.
The example creates an Excel add-in that performs an FFT on an input data
set located in a designated worksheet range. The function returns the FFT
results, an array of frequency points, and the power spectral density of the
input data. It places these results into ranges you indicate in the current
worksheet. You can also optionally plot the power spectral density. You develop
the function so that you can invoke it from the Excel
Tools menu and can select
input and output ranges through a GUI.
To create this add-in requires four basic steps:
1 Build a standalone COM component from MATLAB code.
2 Implement the necessaryVBA code to collect input and dispatch the calls to
your component.
3 Create the GUI.
4 Create an Excel add-in and package all necessary components for
application deployment.
Building the Component
Your component will have one class with two methods, computefft and
plotfft. The computefft method computes the FFT and power spectral
density of the input data and computes a vector of frequency points based on
the length of the data entered and the sampling interval. The
plotfft method
performs the same operations as
computefft, but also plots the input data and
the power spectral density in a MATLAB figure window. The MATLAB code for
these two methods resides in two M-files,
computefft.m and plotfft.m.
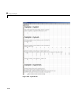
computefft.m:
function [fftdata, freq, powerspect] = computefft(data, interval)
if (isempty(data))
fftdata = [];
freq = [];