
Installation guide

2 Getting Started
2-16
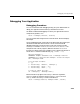
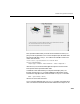
The URL for the players example is
http://<your_domain>/cgi-bin/matweb.exe?mlmfile=players&
on Windows NT. (On Solaris/Linux use
matweb instead of matweb.exe.)
The output looks like
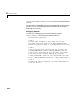
If you would like to experiment on your own with a similar simple
application, use
players as a model to create an M-file that reads your
own text file, e.g.,
myfile.txt, and places data into a MATLAB
structure. To display the result in your Web browser, use the above URL,
changing the value of the
mlmfile argument to the name of your new
M-file. Also, copy the entry for
players in matweb.conf and change the
name of the application within the brackets
[] to the one you have
chosen.
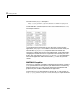
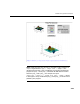
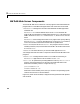
MATLAB Graphics
The webpeaks function, included as a demonstration program, creates a
peaks plot and returns the output to your Web browser. In examining
portions of the
webpeaks code, you will see how to include MATLAB
graphics as part of a MATLAB Web Server application.
To start the
webpeaks demonstration, set the URL in your browser to
http://<your_domain>/webpeaks1.html, the webpeaks input document.