
User Guide
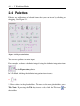
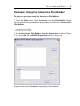
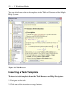

3. In the Add/Edit Expression dialog, enter the expression to plot using 1-
D Math. See Figure 2.5.
Figure 2.5: Interactive Plot Builder: Add/Edit Expression Dialog
4. Repeat steps 2 and 3 for each expression to add to the plot.
5. After adding the expressions, in the Interactive Plot Builder: Specify
Expressions window (Figure 2.4), click Done.
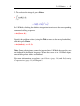
6. In the Interactive Plot Builder: Select Plot Type dialog (Figure 2.3),
select the type of plot, for example, 3-D Plot or 3-D Contour Plot, and
specify the variable ranges, for example, .
7. To immediately create a plot, click Plot. To customize the plot before
generating it, click Options. Set the plot options, and then click Plot.
Maple inserts the plot in the document.
50 • 2 Worksheet Mode