
User Guide

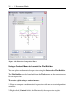
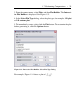
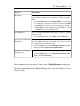

3. From the context menu, select Plots, and then Plot Builder. The Interact-
ive Plot Builder is displayed. See Figure 1.13.
4. In the Select Plot Type dialog, select the plot type, for example, 3-D plot
or 2-D contour plot.
5. To immediately create a plot, click the Plot button. To customize the plot
before generating it, click the Options button.
Figure 1.13: Interactive Plot Builder: Select Plot Type Dialog
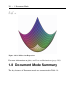
For example, Figure 1.14 shows a plot of .
1.7 Performing Computations • 29