
User Guide

DetailsSteps
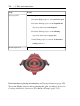
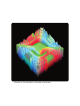
In the Plot Options window:
a. From the Style group box, select patch w/o grid.
b. From the Color group box, in the Light Model
drop-down menu select red-turquoise.
b. From the Color group box, in the Shading
drop-down menu select z (grayscale).
c. In the View group box, select the Constrained
Scaling check box.
Set plot options.
Click Plot.Plot the expression.
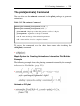
For information on playing the animation, see Playing Animations (page 226).
To see the Maple syntax used to generate this plot, see Maple Syntax for
Creating Animations: Interactive Plot Builder Example (page 225).
224 • 5 Plots and Animations