
User Guide

DescriptionIconName
Change the position of the plot in the plot regionPan
Change the size of the plot without resamplingScale
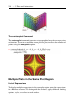
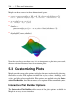
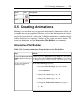
5.5 Creating Animations
Plotting is an excellent way to represent information. Animations allow you
to emphasize certain graphical behavior, such as the deformation of a boun-
cing ball, clearer then in a static plot. A Maple animation is a number of plot
frames displayed in sequence, similar to the action of movie frames. To
create an animation, use the Interactive Plot Builder or commands.
Interactive Plot Builder
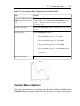
Table 5.14: Creating Animations Using the Interactive Plot Builder
DetailsSteps
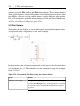
Add the expression sin(i*sqrt(x^2+y^2)/10). For information
on interacting with the Interactive Plot Builder, see Example
1 - Display a plot of a single variable expression (page 193).
Launch the Interactive Plot
Builder and enter the expres-
sion.
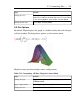
In the Select Plot Type window:
a. From the Select Plot Type drop-down menu,
select Animation.
b. Change the x Axis range to -6 .. 6.
c. Change the y Axis range to -6 .. 6.
d. Change the Animation Parameter (i) range to
1 .. 30.
Set axes and animation
parameter range.
5.5 Creating Animations • 223