
User Guide

DescriptionOption
Defines how the surface is to be drawn, one of: line, patch, patchcon-
tour, patchnogrid, or point for 2-D plots; contour, hidden, or
wireframe for 3-D plots
style
Defines the symbol for points in the plot, one of: box, cross, circle,
point, or diamond
symbol
Defines a title for the plottitle
Defines the thickness of lines in the plotthickness
Controls the transparency of the plot surfacetransparency (3-D)
Defines the minimum and maximum coordinate values of the curve
displayed on the screen
view
For a complete list of plot options, refer to the ?plot/options and
?plot3d/options help pages.
>
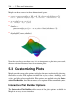
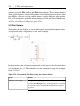
To create a smoother or more precise plot, calculate more points using the
numpoints option.
5.3 Customizing Plots • 221