
User Guide

DetailsSteps
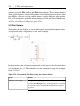
Select Axes, and then Boxed.Change the axes style.
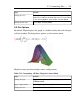
Select Glossiness. Using the slider, adjust the level of
glossiness.
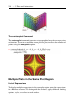
Alter the glossiness.
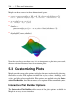
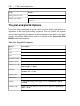
The plot and plot3d Options
If you are using commands to insert a plot, you can specify plot options as
arguments at the end of the calling sequence. You can specify the options
in any order. Applying plot options in the command syntax offers a few more
options and greater control than what is available in the Interactive Plot
Builder and context menus.
Table 5.12: Popular Plot Options
DescriptionOption
Defines the type of axes, one of: boxed, frame, none, or normalaxes
Defines a color for the curves to be plottedcolor
Defines the font for text objects in the plotfont
Controls the amount of light reflected from the surfaceglossiness (3-D)
Defines gridlines in the plotgridlines (2-D)
Controls the light model to illuminate the plot, one of: none, light1,
light2, light3, or light4
lightmodel (3-D)
Defines the dash pattern used to render lines in the plot, one of: dash,
dashdot, dot, or solid
linestyle
Defines a legend for the plotlegend (2-D)
Controls the minimum total number of points generatednumpoints
Controls the scaling of the graph, one of: constrained or uncon-
strained
scaling
Defines how the surface is colored, one of: xyz, xy, z, zgrayscale,
zhue, or none
shading (3-D)
220 • 5 Plots and Animations