
User Guide

DetailsSteps
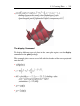
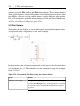
Place the mouse pointer on the curve and right-click (Con-
trol-click, for Macintosh). Note:The curve is selected when
it becomes highlighted. Select Color, and then Green.
Change the color.
Select Style, and then Point.Change the line style.
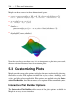
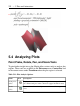
3-D Plot Options
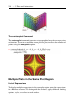
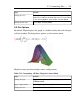
By default, Maple displays the graph as a shaded surface and scales the plot
to fit the window. To change these options, use the context menu.
>
Maple has many preselected light source configurations.
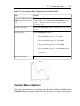
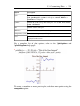
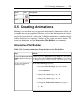
Table 5.11: Customizing 3-D Plots Using the Context Menu
DetailsSteps
Right-click the plot region. Select Style, and then Patch
(Without Grid).
Change the style.
Select Lighting, and then Light Scheme 1.Apply a light scheme.
Select Color, and then Z (Grayscale).Change the color.
5.3 Customizing Plots • 219