
User Guide

options using the Plot toolbar and Plot menu options. These menus display
when a plot region is selected. Regardless of the method used to insert a plot
into Maple, you can use the context menu to apply different plot options.
For a list of options available when plotting in two and three dimensions,
see The plot and plot3d Options (page 220).
2-D Plot Options
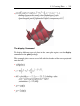
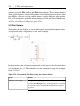
Some plots do not display as you would expect using default option values.
A expression with a singularity is one such example.
>
In the previous plot, all interesting details of the plot are lost because there
is a singularity at x = 1. The solution is to view a narrower range, for example,
from y = 0 to 7.
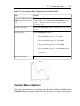
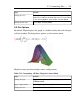
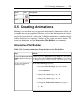
Table 5.10: Customizing 2-D Plots Using the Context Menu
DetailsSteps
1. Right-click the plot region. Select Axes, and then Range.
2. In the Axes Ranges dialog, in the y group box, select the
bottom radio button and enter 0 and 7 in the text regions
provided.
Alter the y-axis range.
218 • 5 Plots and Animations