
User Guide
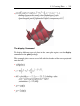
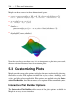
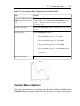
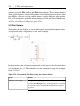
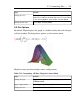
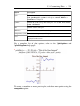
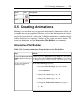

Table 5.9: Customizing Plots Using Interactive Plot Builder
DetailsSteps
Add the expression 2*x^5-10*x^3+6*x-1. For information
on interacting with the Interactive Plot Builder, see Ex-
ample 1 - Display a plot of a single variable expres-
sion (page 193)
Launch the Interactive Plot
Builder and enter the expres-
sion.
In the Select Plot Type window, change the x-axis range to
-2 .. 2.
Set the x-axis range.
In the Plot Options window:
a. From the Line group box, select dot.
b. From the Color group box, select blue.
c. From the Axes group box, select frame.
d. From the Title group box, enter My Plot in the
text field.
Set plot options.
Click Plot.Plot the expression.
Context Menu Options
Using the context menu, you can alter a plot by right-clicking (for Macintosh,
Control-clicking) the plot output. You can also access a large subset of plot
5.3 Customizing Plots • 217