
User Guide
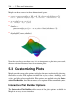

The contourplot Command
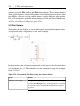
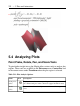
The contourplot command generates a topographical map for an expression
or function. To create a smoother, more precise plot, increase the number of
points using the numpoints option.
>
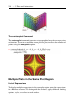
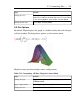
Multiple Plots in the Same Plot Region
List of Expressions
To display multiple expressions in the same plot region, enter the expressions
in a list data structure. To distinguish the surfaces, apply different shading
options, styles, or colors to each surface.
214 • 5 Plots and Animations