
User Guide

>
The plots Package
The plots package contains numerous plot commands for specialized plotting.
This package includes: animate, contourplot, densityplot, fieldplot, ode-
plot, matrixplot, spacecurve, textplot, and tubeplot. For details about this
package, refer to the ?plots help page.
>
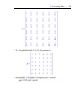
The pointplot Command
To plot numeric data, use the pointplot command in the plots package with
the data organized in a list of lists structure of the form [[x1, y1], [x2, y2],
..., [xn, yn]]. By default, Maple does not connect the points. To draw a line
through the points, use the style = line option. For further analysis of data
points, use the Curve Fitting Assistant, (Tools>Assistants>CurveFitting)
which fits and plots a curve through the points. For more information, refer
to the ?CurveFitting[Interactive] help page.
5.2 Creating Plots • 211