
User Guide

For more information on the plot options described in this section, refer to
the ?plot/options and ?plot3d/options help pages.
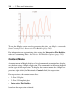
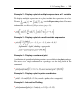
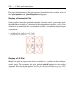
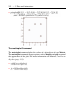
Display a Parametric Plot
Some graphs cannot be specified explicitly. In other words, you cannot write
the dependent variable as a function of the independent variable, y=f(x). One
solution is to make both the x-coordinate and the y-coordinate depend upon
a parameter.
>
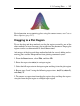
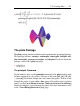
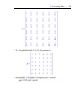
Display a 3-D Plot
Maple can plot an expression of two variables as a surface in three-dimen-
sional space. To customize the plot, include plot3d options in the calling
sequence. For a list of plot options, see The plot and plot3d Options (page 220).
210 • 5 Plots and Animations