
User Guide
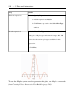
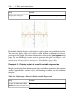
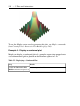
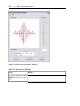

Example 5 - Display a plot in polar coordinates
Cartesian (ordinary) coordinates is the Maple default. Maple also supports
numerous other coordinate systems, including hyperbolic, inverse elliptic,
logarithmic, parabolic, polar, and rose in two-dimensions, and bipolar cyl-
indrical, bispherical, cylindrical, inverse elliptical cylindrical, logarithmic
cosh cylindrical, Maxwell cylindrical, tangent sphere, and toroidal in three-
dimensional plots. For a complete list of supported coordinate systems, refer
to the ?coords help page.
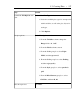
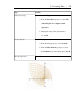
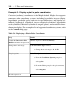
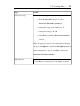
Table 5.6: Displaying a Plot in Polar Coordinates
DetailsStep
Add the expression 1+4*cos(4*theta).Launch the Interactive Plot
Builder and enter an expression.
In the Select Plot Type window:
a. Change the x axis range to 0 .. 8*Pi.
Change the x-axis range.
In the Plot Options window:
a. From the Coordinate System group box,
select polar.
b. From the Color group box drop down menu,
select magenta.
Set plot options.
Click Plot.Plot the expression.
200 • 5 Plots and Animations