
User Guide

DetailsStep
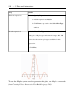
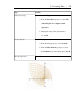
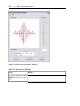
In the Select Plot Type window:
a. From the Select Plot group box, select 2-D
conformal plot of a complex-valued
expression.
b. Change the range of the z parameter to
0 .. 2+2*I.
Select a plot type.
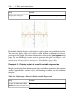
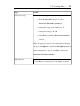
In the Plot Options window:
a. From the Axes group box, select normal.
b. From the Miscellaneous group box, select
the Grid Size drop-down menu option 30, 30.
Set plot options.
Click Plot.Plot the expression.
5.2 Creating Plots • 199