
User Guide
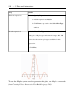
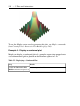

To see the Maple syntax used to generate this plot, see Maple commands
from Creating Plots: Interactive Plot Builder (page 208)
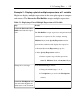
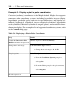
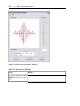
Example 4 - Display a conformal plot
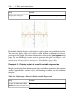
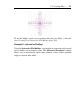
Maple can display a conformal plot of a complex expression mapped onto
a two-dimensional grid or plotted on the Riemann sphere in 3-D.
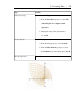
Table 5.5: Displaying a Conformal Plot
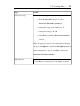
DetailsStep
Add the expression z^3.Launch the Interactive Plot
Builder and enter an expression.
198 • 5 Plots and Animations