
User Guide
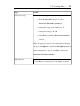

DetailsStep
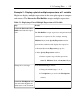
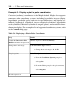
In the Select Plot Type window:
a. Notice the available plot types for an expression
with 2 variables, as well as the plot objects for
each type.
b. Click Options.
Launch the Plot Options win-
dow.
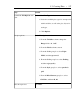
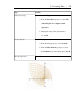
In the Plot Options window:
a. From the Variables column, change the
Range fields to 0 .. 0.05.
b. From the Labels column, enter z.
c. From the Color group box, select Light
Model, and then green-red.
d. From the Color group box, select Shading,
and then z (grayscale).
e. From the Style group box, select patch w/o
grid.
f. From the Miscellaneous group box, select
Grid Size, and then 40, 40.
Set plot options.
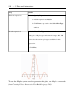
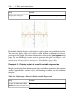
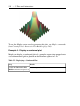
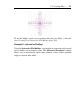
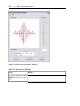
Click Plot.Plot the expression.
5.2 Creating Plots • 197