
User Guide

DetailsStep
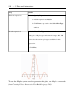
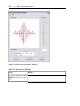
Execute the inserted command, that is, display the plot.Display the actual plot.
By default, Maple displays each plot in a plot region using a different color.
You can also apply a line style such as solid, dashed, or dotted for each ex-
pression in the graph. For more information, refer to the ?plot/options help
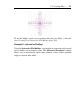
page. To see the Maple syntax used to generate this plot, see Maple com-
mands from Creating Plots: Interactive Plot Builder (page 208)
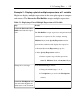
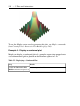
Example 3 - Display a plot of a multi-variable expression
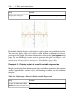
Maple can display three-dimensional plots and offers numerous plot options
such as light models, surface styles, and shadings to allow you to customize
the plot.
Table 5.4: Displaying a Plot of a Multi-variable Expression
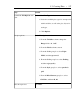
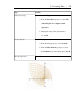
DetailsStep
Add the expression (1+sin(x*y))/(x^2+y^2).Launch the Interactive Plot
Builder and enter an expression.
196 • 5 Plots and Animations