
User Guide
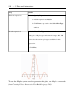
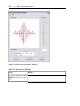

Example 2 - Display a plot of multiple expressions of 1 variable
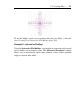
Maple can display multiple expressions in the same plot region to compare
and contrast. The Interactive Plot Builder accepts multiple expressions.
Table 5.3: Displaying a Plot of Multiple Expressions of 1 Variable
DetailsStep
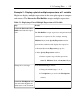
1. Launch the Interactive Plot Builder.
The Plot Builder accepts expressions and performs basic
calculations on expressions. For example, entering
diff(sin(x^2), x) in the Specify Expression window
performs the calculation and displays the expression
as 2*cos(x^2)*x in the Expression group box.
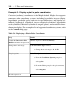
2. In the Specify Expressions window:
a. In three separate steps, add the expressions
sin(x^2), diff(sin(x^2),x), and int(sin(x^2), x).
Launch the Interactive Plot
Builder and enter the expres-
sions.
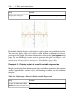
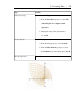
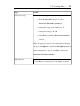
In the Select Plot Type window:
a. Change the x Axis range to -3 .. 3.
b. Click Options to proceed to the Plot Options
window.
Change the x-axis range.
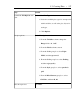
Click Command.Launch the Plot Options win-
dow and return the plot com-
mand syntax to the document.
5.2 Creating Plots • 195