
User Guide

DetailsStep
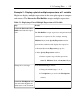
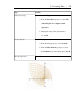
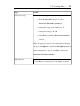
1. In the Specify Expressions window:
a. Add the expression, sin(x)/x.
b. Click Done.to proceed to the Select Plot Type
window.
Enter an expression.
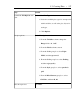
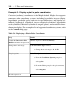
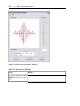
1. In the Select Plot Type window, notice the default
setting of a 2-D plot type and an x axis range, -10 .. 10.
Notice also the various plot types available for this
expression.
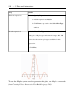
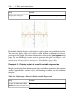
2. Click Plot.
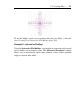
Plot the expression.
To see the Maple syntax used to generate this plot, see Maple commands
from Creating Plots: Interactive Plot Builder (page 208)
194 • 5 Plots and Animations