
User Guide


• Specify Expressions window - Add, edit, or remove expressions and
variables. Once finished, you can advance to the Select Plot Type win-
dow.
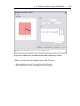
• Select Plot Type window - Select the plot type and corresponding plot,
and edit the ranges. Once finished, you can display the plot or advance
to the Plot Options window.
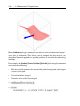
• Plot Options window - Apply plot options. Once finished, you can dis-
play the plot or return the command that generates the plot to the docu-
ment.
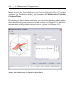
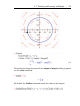
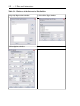
Example 1 - Display a plot of a single variable expression
Maple can display two-dimensional graphs and offers numerous plot options
such as color, title, and axes styles to customize the plot.
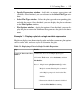
Table 5.2: Displaying a Plot of a Single Variable Expression
DetailsStep
1. Ensure the cursor is in a Maple input region.
2. From the Tools menu, select Assistants, and then
Plot Builder.
Notes: 1. Maple inserts plots[interactive](); in the
Maple document. Entering this command
at the Maple prompt also invokes the Plot
Builder.
2. Interaction with the document is disabled
while the Plot Builder is running.
Launch the Interactive Plot
Builder.
5.2 Creating Plots • 193