
User Guide

For information on plotting options, such as title, see Plots and Anima-
tions (page 189).
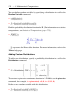
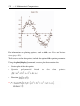
To fit a curve to the data points, include the optional fit equation parameter.
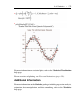
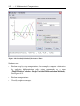
Using the plots[display] command, create a plot that contains the:
• Scatter plot of the data points
• Quartic polynomial fitted to the data points:
• Function
>
178 • 4 Mathematical Computations