
User Guide

Plotting
You can generate statistical plots using the visualization commands in the
Statistics package. Available plots include:
• Bar chart
• Frequency plot
• Histogram
• Pie Chart
• Scatter Plot
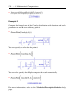
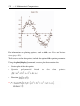
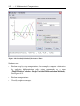
For example, create a scatter plot for a distribution of points that vary from
by a small value determined by a normally distributed sample.
>
>
>
>
>
4.6 Statistics • 177