
Instruction Manual

SECTION 3 - Data Logging
3.1.2
© Copyright 2008DN IS-IPPC101.1
® Registered trademark MAMAC SYSTEMS, Inc.
19 of 20
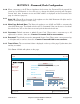
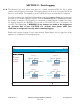
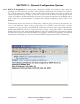
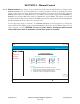
Data Logging: The Maverick logs data in a CSV (Comma Separated Values) file which can be
imported into NotePad, WordPad, Word or Excel. To view a CSV file of the logged data, navigate
to the Data Logging icon on the navigation bar and highlight CSV. Click the desired Input and
the appliance will serve up the data. To Save or to Import the CSV file, click File on the browser
navigation bar and highlight Save As. Enter a file name and save the data on the laptop/PC or
PDA. Once saved, the file can be imported into any application which accepts CSV file format or
emailed.
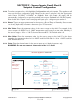
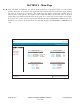
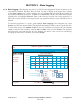
To view the logged data as a graph, again highlight Data Logging in the navigation bar, select
Graphs and click the desired Input. The Maverick will initialize a JAVA script and graph the data.
To refresh the graph, click Update Graph. If the user would like to narrow the X scale (sensor
value) to enhance the resolution, enter the Min and Max values and click Graph. The appliance
will refresh the graph with the new X scale. Similarly, the time Y scale can also be narrowed by
changing the start and/or end times and clicking Graph.
13.34:59
May 9, 2008
IP Sensor Appliance:
Main
Manual Control
Data Logging
Configuration
MAMAC UNO
Configuration | Password/Clock
Copyright 2008
c
www.mamacsys.com
R
Registered trademark MAMAC Systems, Inc.
INPUT 1 DATA GRAPH
100 % RH
80 % RH
60 % RH
40 % RH
20 % RH
0 % RH
8:00
Min Value Max Value
8:10 8:20 8:30 8:40 8:50 9:00 9:10
Hour : Minute : Second Month / Date / Year
Start Time & Date:
End Time & Date:
7
9
51
15
53
08
5
5
9
9
2008
2008
/
/
/
/
:
:
:
:
our
:
Minute
:
Sec
ond
Mo
51
53
5
:
:
Graph
mam
R
egi
s
e:
e
:
7
9
m
acs
y
s.c
om
R
51
08
15
53
5
5
:
:
:
:
Grap
h
Update Graph
0 100