
User manual
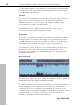
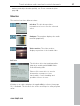
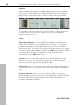
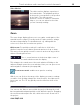
Table Of Contents
- Copyright
- Preface
- Table of Contents
- Support
- More about MAGIX
- Introduction
- Overview of the program screen
- Track window and constant control elements
- Import
- Cut sound – Working with objects
- Remove
- Enhance
- Export
- File Menu
- Edit Menu
- Effects Menu
- Options menu
- Standard mouse mode
- Cut mouse mode
- Zoom mode
- "Delete objects" mode
- Draw volume curve mouse mode
- 2 tracks
- Stereo display
- Comparisonics waveform display
- Activate Volume Curves
- Overview track
- Lock all objects
- Play parameter
- Units of measurement
- Mouse Grid Active
- Auto crossfade mode active
- Display values scale
- Path settings
- Tasks menu
- Online menu
- Help menu
- Keyboard layout and mouse-wheel support
- Activate additional functions
- Appendix: MPEG Encoder Settings
- MPEG glossary
- MPEG-4 encoder settings
- Index

38 Track window and constant control elements
www.magix.com
Analyzer
Audio material being played is graphically illustrated in the visualizer.
You can choose between the following display options: Peak Meter,
Oscilloscope, Phase Correlation, Spectroscope and Spectrogram.
The visualizer can be modified to your taste. Click "setup" and in the
context menu, choose from a number of options, including the
update speed, color, etc.
Setup
Value range/display: You can adjust the minimum and maximum
values for the display of the visualization in all modes. The numeric
peakmeter display is activated and deactivated via the Peakmeter
value menu item. The option "Non-linear dB scale stretches the range
of interest slightly below 0dB. An additional RMS value display (visible
as a small white bar in the peakmeter) can be activated and
deactivated via the RMS menu item.
Speed: Here you can define the speeds of all visualization modes.
However, you can also customize the speeds. The measurement
units for a drop are specified in 10 dB (ms/dB).
Peak hold: Here you can enter a time value for holding and dropping
of the peak levels. You can also enter these time values manually in
"ms".
Frequency bands: Here you can enter the number of frequency
bands displayed in the spectroscope. Warning: Higher band numbers
means a higher CPU load and thus reduced PC performance or
portable visualization display.