
11.0

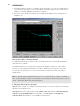


Table Of Contents
- Copyright
- Welcome
- System Requirements
- Contact
- Installation
- System settings
- What’s new in version 11?
- What's new since 10.2
- What's new since 10.1
- Screen elements
- Samplitude quickstart
- General functions in the project window
- Object-oriented audio editing
- Object editor
- Techniques for Working with Objects
- Integrating wave files as objects in the VIP
- Integrating sections from wave projects as objects
- The difference between loading and importing audio files.
- Integrating CD tracks as objects into VIP
- Selecting and Unselecting an Object
- Object handles
- Selecting and unselecting several objects, inverting the sel
- Moving objects
- Changing the length and start time of an object
- Duplicating, copying, and inserting objects
- Change waveform view
- Editing fades in the Object Editor or by using the handles.
- Object effects
- Locking objects
- Destructively editing an object
- Moving to a defined position
- Group/Ungroup objects
- Linking objects
- Overlapping objects
- Gluing objects
- Looping objects
- Trimming objects
- Replacing an audio file below the object
- Moving audio material below the object
- Managers
- Mixer
- Effects – Organization and work flow
- Effects and plug-ins in an overview
- Remix Agent
- Stereo Editor
- Surround Sound
- Creating a New VIP with the Mixer in Surround Format
- Converting an existing stereo VIP into a VIP with mixer in s
- Project Surround Setup
- Surround Panning
- Surround Panorama Module
- Panorama Modes of the Surround Panorama Module
- 2-channel surround mode
- Stereo and mono signal processing in surround projects
- Working reciprocally in Stereo and Surround Format
- Automation of the Surround Panorama Module
- Effects in Surround Projects
- Editing Surround Sound Automation
- Surround track bouncing
- MIDI in Samplitude
- MIDI Editors
- Open MIDI Editor
- Working with the MIDI Editor
- MIDI functions
- Quantize to grid
- Quantization - Window view
- Quantization settings
- Quantization settings - Preset
- Quantization setting - Q snap / Q length
- Quantization setting - N-tuplets (8, 5, 7)
- Quantization setting - Groove template
- Quantization setting - indicates beats/beat signature
- Quantization setting - Q threshold
- Quantization setting - Q window
- Select notes within the Q range
- Quantization setting - swing
- Quantization - Offset
- Quantization setting - humanize
- Quantization setting - Soft Q
- Standard quantization
- Undo quantization/reset
- Step recording via keyboard or controller keyboard
- Cell edit mode
- Velocity mode
- Piano Roll (Matrix Editor)
- Drum Editor
- Controller Editor
- List Editor (event list)
- Multi-object editing (MO editing)
- Score Editor
- (Samplitude Pro)
- Open Score Editor
- Score Edit modes
- Score sheet
- Editing MIDI data in the score sheet
- Adjusting and optimizing the score.
- Note allocation in multiple systems
- Multi-voice notation
- MIDI score settings
- Note system settings
- Display quantization
- Interpretation options
- Notation symbol
- Page format settings
- Print notes
- Tips
- Score music XML export
- MIDI editor shortcut keys
- Software-Instrumente/VST-Plug-ins/ReWire
- Installation of VST plug-ins
- Load software instruments
- Apply plug-ins at wave level
- Load plug-ins at object level
- Load plug-ins at track level
- Load plug-ins at master level
- Routing settings during software instrument loading
- VST MIDI out + Audio out recording
- Routing of VST instruments using the VSTi manager.
- Adjust instrument parameters
- Plug-in panel - graphic interface
- Plug-in parameter dialog
- Plug-in menu functions
- Play and monitor instruments live
- VST instrument preset selection
- Sidechain input
- Freeze plug-ins
- ReWire client application
- Automation
- Track automation - Basic approach
- Automation modes
- Object automation
- Master automation
- Automation – Context menu
- Curve generator
- MIDI controller automation
- VST plug-in/VST parameter dialog
- Automation recording in read mode
- Automation draw mode
- Edit automation curves
- Move automation curve with audio/MIDI data
- Automation/MIDI controller settings
- Synchronization
- Hardware controller
- Preset keyboard shortcuts
- Signal flow
- Glossary
- Active section
- Audio markers
- Automation
- AUX bus
- Clip
- Context menu
- Crossfade
- Destructive editing
- Fade
- Grid/Marker bar
- Handle
- Hybrid Engine and Economy Tracks
- Latency
- Latency comparison
- Level fader
- Lock key
- Marker
- Mouse modes
- Menu
- MIDI object
- Monitoring
- Objects
- Object Editor
- Object Mode
- Object-Orientated
- Play Cursor
- Range
- Routing
- Scroll bar
- Scrub
- Section
- Setup button in the VIP
- Status display
- Submix Bus
- Surround AUX bus
- Surround sound in Samplitude
- System Settings
- Tempo marker
- Time position input field
- Title bar
- Tool bar
- Tool Tips
- Track
- Virtual Project
- VirtClip
- Visualization
- Wave Projects
- Wave Editing
- Workspace
- Zoom
- Menu reference
- File menu
- New Virtual Project (VIP)
- Open
- Load/Import
- Save project
- Save project as
- Save project copy
- Save complete VIP in
- Save project as EDL
- Save project as template
- Burn project backup on CD/DVD
- Save object
- Save session
- Rename project
- Delete Wave Project(s)
- Delete virtual project (*.vip)
- Export audio
- Batch processing
- Disconnect Internet
- FTP download
- Close project
- Exit
- Used projects
- Edit menu
- View menu
- Track menu
- Insert new tracks
- Cut tracks
- Copy tracks
- Paste tracks
- Deletes tracks
- Track properties
- Track effects
- Track options
- Pan/Surround Editor (Stereo editor)
- VST Instrument Editor
- Track visualization
- Hide track
- Unhide all tracks
- Maximize track
- Minimize none
- Display subtracks
- Freeze track
- Edit track freeze
- Unfreeze track
- Alternative revolver tracks
- Activate next/previous track
- Object menu
- New object
- New synth object
- Cut objects
- Split objects
- Trim Objects
- Heal/Unsplit Objects
- Glue objects
- Freeze objects
- Lock objects
- Move/Edit objects/crossfade
- Mute object
- Build looped object
- Set hotspot
- Delete Hotspot
- Select objects
- Group objects
- Ungroup objects
- Object effects
- Object color/name
- Object Editor
- Object Manager
- Take Manager
- Take composer
- Wave Editing
- Edit a copy of wave content
- Edit Root VIP
- Automation menu
- Edit curve
- Delete all curves
- (Track) automation mode
- MIDI controller/automation
- Hide automation
- Display track automation
- Display object automation
- Display selected curves only
- Display unselected curves (cannot be activated)
- Display unselected curves (can be activated)
- Delete curve points
- Volume curve active
- Pan curve active
- Range menu
- Range all
- Move play cursor
- Edit range
- Move range start to left
- Move range start to right
- Move range end to left
- Move range end to right
- Range to start
- Range to end
- Flip range left
- Flip range right
- Beginning of range > 0
- Beginning of range < 0
- End of range > 0
- End of range < 0
- 0 > Range < 0
- Range start to left marker
- Start of range to left object edge
- Range end to right marker
- Set the end of the range to the right object edge
- Range over all selected objects
- Remove section
- Range over no track
- Range over current track
- Range over all tracks
- Range length to
- Split range
- Split range for video
- Store range
- Get range
- Get range length
- Store markers
- Get markers
- Markers to range borders
- Set Markers on Silence
- Comparisonics audio search
- Set new Audio marker
- Copy audio markers to VIP markers
- Copy VIP marker to audio marker
- Erase Marker
- Deletes Markers in Range
- Delete all markers
- Recall last range
- Range Editor
- Range Manager
- Edit time display
- Effects menu
- Notes on offline effect editing
- Extended options for destructive effect calculation
- Amplitude
- Dynamics (Overview)
- What compressors are available in Samplitude?
- Which compressor should be used and when?
- Dynamics (Compressor / Expander / Gate / Limiter)
- Advanced Dynamics
- Advanced dynamics – General controls and presets
- Advanced Dynamics – Editing the reference line (graphically)
- Advanced Dynamics – Editing the reference line (parametrical
- Gate
- Limiter
- Advanced Dynamics – Envelope
- Advanced Dynamics - Dynamic parameters
- Advanced Dynamics – Dynamic Scope
- Advanced Dynamics – Tips and tricks
- Multiband Dynamics
- Multiband Dynamics – Overview
- Multiband Dynamics – General controls
- Reference line
- Setup
- Bypass dyn. (bypass dynamics):
- Bypass all:
- Multiband Dynamics – Setups and parameters
- Parameters for the dynamic sections
- Parameters for the output:
- Mode
- Out (All)
- Limiter On/ Edit (only in the Master area of the mixer and i
- Separation frequencies
- Band separation (in the setup area)
- Multiband Dynamics – Filter bank for experts
- Tips & tricks: Strategies to cope with the flood of paramete
- Step 1: Global presets for all bands
- Step 2: Fine-tuning of individual bands
- Comparing at constant volume levels
- Reserved
- Multiband stereo enhancer
- sMAX11
- efx_Compressor
- am-munition, am-track, am-phibia, am-pulse
- Frequency/Filter
- Parametric equalizer
- EQ116
- Real-time (object) FFT filter/sound cloner
- Sound Cloner functionality
- Sound cloner controls
- FFT filter/spectral analysis (offline)
- FFT Analysis Filter – Getting Started
- 1. Filtering and frequency analysis
- 2. Filtering in "Direct draw" mode
- 3. "Dynamic filter" mode (fading between two filter curves).
- 4. Filtering a sample/object with the frequency response of
- 5. Transferring the frequency response (spectral envelope) f
- FFT Filter – Graphical view
- Overview of the curves
- Faders and zoom buttons
- Switch for the display views
- FFT Filter – Controls
- Filter
- Filter mode
- Draw mode
- FFT Filter – Expert dialog
- Analysis parameters
- Filter parameters
- Display
- Filter transition
- FFT Filter – The right settings
- Frequency analysis
- Filter
- FFT Filter – Problems & solutions
- Modulation effects when using extreme filter settings for lo
- Problems with the real-time preview when using higher rates:
- It is not possible to completely fade out individual parts o
- You have corrected the frequency response of a sample and an
- Resonance-like sounds occur even with broadband band passes.
- In the "Fade start" or "Fade end" filter mode, fading does n
- Brilliance Enhancer
- Filtox/De-esser
- Delay/Reverb
- Delay
- Room Simulator
- efx_Reverb/efx_StereoDelay
- Ecox/Variverb
- Time/Pitch
- Resampling / Timestretching / Pitchshifting
- Elastic Audio (Easy)
- Elastic Audio – General
- Elastic Audio - Editing modes
- Elastic Audio – "Relative" mode (not in Elastic Audio Easy)
- Overview of graphics in "Relative" mode
- Elastic Audio – "Direct" mode
- Overview of graphics in "Direct" mode
- Elastic Audio – Basics
- Opening Elastic Audio Editor
- Interaction between Elastic Audio Editor and objects in the
- Loading objects into the Elastic Audio Editor
- Elastic Audio - Control elements
- Edit VIP object
- Application of the Elastic Audio Editor
- Pitch slice objects and VIP objects
- Elastic Audio: Overview of keyboard commands and configurati
- Selecting slice objects and VIP objects
- Pitch automation including changes to the length (not in Ela
- Pitch automation without change in length (not in Elastic Au
- Pitch correction (intonation correction) with monophonic aud
- Manual correction of the whole pitch of a pitch slice
- Automatic correction of the whole pitch of a melody slice.
- Automatic correction of the pitch characteristic with quanti
- Correcting pitch increase or decrease
- Creating frequency modulations like warblers and vibrato
- Creating second voices or harmonizing effect (not in Elastic
- Distortion
- Restoration
- De-clipper
- De-clipper
- De-clicker/De-crackler
- DeHisser
- De-noiser – Remove unwanted noise
- De-noiser – Remove unwanted noise
- Get noise sample
- Remove DC offset (offline)
- Spectral Cleaning (offline)
- Spectral cleaning – the basics
- Spectral cleaning – operation
- Spectral cleaning – toolbar
- Spectral cleaning – Edit selection
- Spectral cleaning - Click markers
- Stereo/Phase
- Modulation/Special
- Sample manipulation
- Plug-ins...
- essentialFX
- MAGIX Plug-ins
- Further console elements:
- Analog Modeling Suite: am-track
- Analog Modelling Suite: am-pulse
- Analog Modeling Suite: am-phibia
- Analog Modelling Suite: am-munition
- CORVEX – Chorus/Flanger
- ECOX – Echo/Delay
- FILTOX – Multimode filter
- De-esser
- VariVerb Pro
- Vandal
- Particulars of Vandal
- Quick start via preset selection
- Tuner
- Input
- Stomp boxes
- Overdrive/Distortion
- Modulation effects
- Volume/Dynamics
- Filter/EQ
- Vandal - Amplifier
- Guitar amp
- Bass amp
- Cabinet simulation
- Vandal - Quick start with amp and cabinet simulation
- Rack effects (FX1/FX2)
- Scene memory
- Parameter control via MIDI and remote
- Edit left/right channel only
- Apply effects offline
- Tools menu
- Trackbouncing
- Range bouncing (internal mixdown)
- Remove unused samples
- Delete freeze data
- Compile project data
- Waveform Generator
- SMPTE Generator
- New manager...
- Managers
- Audio marker manager
- Start Windows Explorer
- Timestretch/Pitchshift Patcher
- Remix Agent – Tempo and beat recognition
- Remix Agent – Applications
- Remix Agent – Requirements
- Starting the Remix Agent
- Remix Agent – Working method
- Step 1: Tempo recognition
- Step 2: Check the automatic tempo and bar recognition
- Correction of beat positions and tempo
- Step 3: Determining the start of a bar:
- Step 4: Applying BPM and bar recognition
- Create remix objects
- Create remix objects – Audio quantization
- Remix objects in Loop mode
- Create remix objects – Set arrangement tempo to the object t
- Tempo alignment
- Apply arrangement tempo to object tempo
- Set arrangement tempo to object tempo
- Save tempo and bar info
- Playback menu
- Tempo menu
- Tempo/time signature
- Set new tempo marker
- Set new time signature
- Set new bar position marker
- Ignore all time markers / use project beat
- Working with tempo and beat markers
- Metronome active
- Metronome Options
- Audio quantization wizard
- Define transients
- Create MIDI trigger from transients
- Consolidate transients
- Split at transients
- Create groove template from transients
- Create groove
- Quantization settings - Preset
- Quantization settings - Grid
- Quantization setting - indicates beats/beat signature
- Quantization setting - Q threshold
- Quantization setting - Q window
- Quantization setting - swing
- Quantization setting - Soft Q
- Quantization - Offset
- Quantization setting - default
- Quantize object position
- Soft AQ
- Remove gaps between objects
- Undo/Redo/Reset quantization
- Reset object quantization
- Audio quantization – Tutorial
- MIDI menu
- New MIDI Object
- New MIDI track
- MIDI Editor
- Object Editor
- Glue MIDI Objects
- Trim MIDI objects
- MIDI bouncing
- Retrospective MIDI recording
- Demix MIDI objects by channels
- MIDI note quantize (standard)
- advanced MIDI quantization
- MIDI Humanize Q
- MIDI quantization settings...
- MIDI velocity dynamics settings
- Apply MIDI velocity dynamics
- Set MIDI velocity to fixed value
- Randomize MIDI velocity
- Track options
- Track MIDI Record
- MIDI controllers
- VST instrument editor
- MIDI Options
- MIDI Record Mode
- MIDI Panic – All Notes off
- CD/DVD menu
- Import audio CD track(s)
- Import audio DVD
- Set CD Track Index
- Set CD sub index
- Set CD pause index
- Set CD end index
- Set Track Indices on Silence
- Set track indices on object edges
- Set track indices on object edges - Options
- Remove index
- Remove all indices
- Make CD
- Create Audio DVD...
- Show CDR drive Information....
- Show CDR Disc Information...
- CD Track / Index Manager
- CD disc options
- CD text/ MP3 ID editor
- Set pause time
- Set start Pause Time....
- CD arrange mode
- Get FreeDB title info
- FreeDB options
- Search CD online and set track indices
- Audio ID
- Options menu
- Project properties
- Project options
- Track options
- Synchronization active
- Synchronization Setup
- MMC setup
- Program Preferences
- VIP mouse mode
- "Universal" mode
- Right mouse button: Context menu
- Left mouse button:
- "Range" mode
- Right mouse button: Context menu
- Left mouse button:
- Curve mode
- Right mouse button: Context menu
- Left mouse button
- Object mode
- Right mouse button: Context menu
- Left mouse button:
- Object and Curve Mode
- Right mouse button: Context menu
- Left mouse button
- Studio 4.00 mouse mode
- Right mouse button
- Left mouse button
- Object cut mode
- Right mouse button: Context menu
- Left mouse button
- Pitchshift/Timestretch mode
- Right mouse button: Context menu
- Left mouse button
- Draw Volume
- Right mouse button: Context menu
- Left Mouse Button: Free-hand draw function for volume curves
- Automation draw mode
- Right mouse button: Context menu
- Left mouse button
- Scrub Mode
- Right mouse button: Context menu
- Left mouse button:
- Zoom Mode
- Right mouse button: Zoom out
- Left mouse button: Zoom in
- Color mode
- Left mouse button: Set the object background color
- Right mouse button: Change the object waveform color
- Wave Project mouse mode
- Object mode
- Edit keyboard shortcuts and menu
- MIDI editor/Special buttons/Mouse wheel/Mouse
- Adjust toolbars
- Rest toolbars
- Grid Lines
- Font Selection
- Font for time display
- Font for the manager
- MIDI Options
- Metronome Options
- Audio Metronome
- MIDI Metronome
- Display options
- Color Setup
- Undo settings
- Dithering Options
- Advanced buffer settings
- Resampling quality options
- Lock settings
- Set pre-roll time
- Destructive effect calculation
- VIP mouse mode
- System options
- Window menu
- Cascade
- Tile
- Untile
- Arrange Icons
- Main Toolbar
- Main Toolbar 2
- Position bar
- Position bar 2
- Punch/ Play bar
- Mouse Mode Toolbar
- Range bar
- Grid toolbar
- Workspace bar
- Button bar
- Status bar
- Mixer
- Track Editor
- Time display
- Visualization
- Transport Control
- Manager
- Video Window
- Close all Windows
- Iconise all Wave Projects
- Hide all Wave Projects
- Half Height
- 1, 2, …
- Help menu
- Index
486 EFFECTS MENU
"Min. range" in the "Expert" dialog. The precise values for damping / dB increase are
shown in the axis labeling to the right.
The volume fader moves the filter curve up or down and can be used to control the entire
volume.
• To the bottom left you'll find four buttons for the zoom function. A "+" changes to the
next zoom level, "-" changes back a level. There are in total 10 zoom levels available.
With the "All" and "Max" buttons, the display can be set to the smallest/highest zoom
levels. Clicking on the "Max." button again will return you to the previous zoom level. You
can use the fader beneath the display to move the curve section. The selected
frequency range is then shown in the display in Hz.
Switch for the display views
Below the graphic, there are four switches can be used to toggle between the different
view modes.
Display mode: Here you can have the frequency response show as a curve or line
diagram. The line display permits a better overview in the low-frequency range, where there
are fewer frequency ranges.
Hz/Notes: This option allows you to display the graphic in Hz or musical notes. The note
display is only available in the logarithmic frequency display (Freq: log).
Freq lin/log: Linear display of frequency provides a more detailed view of the high end.
Logarithmic display of frequency provides a more detailed view of the low end. The
logarithmic display corresponds to the human perception of volume. Like on a keyboard of
a key instrument, the (graphic) spacing of the intervals, i.e. halftones, is uniform across the
entire range.
dB lin/ log: Here you have a choice of selecting a logarithmic or linear scale for the levels.
The logarithmic display corresponds to the human perception of volume.
FFT Filter – Controls
Filter
Analyze all: After pressing this button the frequency response of the entire sample/object
is calculated. This function is only available to you in "Static" filter mode. Once this function
is carried out, the button deactivates.
Analysis > Filter: The red filter curve is calculated from the frequency response of the
sample/object. Use the analysis if you want to filter a sample/object with the frequency
response of a different one or you want to transfer the frequency response to a different
sample/object.
Invert filters: Here the filter curve is inverted. The purpose of this function is to correct the
frequency range of rooms or loudspeakers.
Match Filter: Here, a filter curve is calculated which adapts the frequency response of the
sample/object to the filter curve of a preset. This is useful if the filter curve contained in the
preset has been acquired from the frequency response of a reference mix as the sound
characteristics of the reference mix can be transferred in a certain similar way.