
User Guide

Drawing 101
Adding pictographs to charts
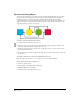
Pictographs represent data visually, according to the type of data shown. For example, instead of a
simple bar to represent a dollar amount, you can add a pictograph of a dollar sign or a stack of
coins.
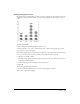
To create a pictograph:
1 Select and copy the FreeHand graphic you’d like to use.
2 Use the Subselect tool to select a column in the series to which you’ll apply the pictograph.
3 Select Xtras > Chart > Pictograph.
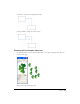
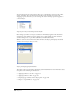
4 In the Pictograph dialog box, click Paste In to display the copied object in the preview window.
5 To copy the selection in the preview window to the Clipboard, click Copy Out.
6 Choose how to fill the columns:
• Select Repeating to fill the columns with repeating copies of the object. Partial objects are used
to represent incremental values.
• Deselect Repeating to fill the column with one scaled object.
7 Click OK.
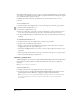
To remove a pictograph from your chart:
Select the column from which you want to remove the pictograph, and select
Xtras > Chart > Remove Pictograph.