
User Guide

154 Chapter 4: Writing and Debugging Scripts
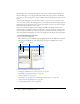
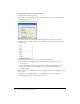
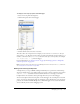
The Debugger shows a hierarchical display list of movie clips currently loaded in Flash Player.
Using the Debugger, you can display and modify variable and property values as the SWF file
plays, and you can use breakpoints to stop the SWF file and step through ActionScript code line
by line.
You can use the Debugger in test mode with local files, or you can use it to test files on a web
server in a remote location. The Debugger lets you set breakpoints in your ActionScript that stop
Flash Player and step through the code as it runs. You can then go back to your scripts and edit
them so that they produce the correct results.
After it’s activated, the Debugger status bar displays the URL or local path of the file, tells
whether the file is running in test mode or from a remote location, and shows a live view of the
movie clip display list. When movie clips are added to or removed from the file, the display list
reflects the changes immediately. You can resize the display list by moving the horizontal splitter.
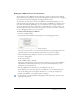
To activate the Debugger in test mode:
• Select Control > Debug Movie.
This command exports the SWF file with debugging information (the SWD file) and enables
debugging of the SWF file. It opens the Debugger and opens the SWF file in test mode.
For more information, see the following topics:
• “Debugging a SWF file from a remote location” on page 155
• “Displaying and modifying variables” on page 157
• “Using the Watch list” on page 158
• “Displaying movie clip properties and changing editable properties” on page 158
• “Setting and removing breakpoints” on page 159
• “Stepping through lines of code” on page 160
Display list Code view
Status bar
Watch list