
User Guide

Writing Scripts with Lingo 437
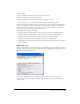
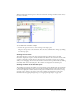
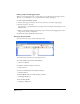
When the Debugger window opens, it shows the current line of Lingo and offers several choices
for what to run next.
To see which is the current line of Lingo:
• Look for the green arrow next to a line of Lingo in the Script pane.
The green arrow points to the current line. You can’t select a different line of Lingo by clicking
it in the Script pane.
Viewing the call stack
The Call Stack pane, located in the upper left of the Debugger window in the preceding
illustration, displays the sequence of nested handlers that ran before the current line of code. This
sequence is called the call stack. Use the call stack to keep track of the structure of your Lingo
while you are debugging. You can view the variables associated with a specific handler by clicking
the handler name in the Call Stack pane. The variables are displayed in the Variable pane.
Viewing variables in the Variable pane
The Variable pane displays the variables associated with the current handler. The current handler
is the handler displayed in the Script pane and the last handler displayed in the Call Stack pane.
You can also display the variables associated with previous handlers in the call stack. As you step
through a script, changes to the values of any of the variables are displayed in red. For more
information about stepping through scripts, see “Stepping through scripts” on page 439.