
User Guide

Debugging in the Debugger window 95
To add a breakpoint that will open the Debugger window:
1 In the Script window, open the script that should contain the breakpoint.
2 Click in the left margin of the Script window next to the line of code where you want the
breakpoint to appear, or place the insertion point on the line of code and click Toggle
Breakpoint. Your code will stop executing at the beginning of this line, and the Script window
will enter debugging mode.
If the Script window is open when Director encounters a script error or a breakpoint, the
Debugger window replaces the Script window.
To stop debugging, do one of the following:
• Click the Run Script button in the Debugger window. This resumes normal script execution.
• Click the Stop Debugging button in the Debugger window. This stops both the debugging
session and the movie.
The Script window reappears in place of the Debugger window.
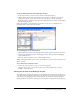
When the Debugger window opens, it shows the current line of code and offers several choices for
what to run next.
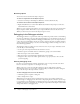
To see which is the current line of code:
• Look for the green arrow next to a line of code in the Script pane.
The green arrow points to the current line. You cannot select a different line of code by
clicking it in the Script pane.
Viewing the call stack in the Debugger window
The Call Stack pane displays the sequence of nested handlers that ran before the current line of
code. This sequence is called the call stack. Use the call stack to keep track of the structure of your
code while you are debugging. You can view the variables associated with a specific handler by
clicking the handler name in the Call Stack pane. The variables are displayed in the Variable pane.