
User Guide


94 Chapter 4: Debugging Scripts in Director
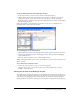
Removing objects
You can also remove items from the Object inspector.
To remove a single item from the Object inspector:
• Select the item and press the Backspace (Windows) or Delete (Macintosh) key.
To clear the entire contents of the Object inspector:
• Right-click (Windows) or Control-click (Macintosh) inside the Object inspector and select
Clear All from the context menu.
When you open a separate movie from the one you are working on, the objects you entered in the
Object inspector remain. This makes it easy to compare different versions of the same movie.
When you exit Director, the items in the Object inspector are lost.
Debugging in the Debugger window
The Debugger window is a special mode of the Script window. It provides several tools for finding
the causes of problems in your scripts. By using the Debugger, you can quickly locate the parts of
your code that are causing problems. The Debugger window allows you to run scripts one line at
a time, skip over nested handlers, edit the text of scripts, and view the values of variables and other
objects as they change. Learning to use the tools in the Debugger window can help you become a
more efficient programmer.
The Debugger window can help you locate and correct errors in your scripts. It includes several
tools that let you do the following:
• See the part of the script that includes the current line of code.
• Track the sequence of handlers that were called before getting to the current handler.
• Run selected parts of the current handler.
• Run selected parts of nested handlers called from the current handler.
• Display the value of any local variable, global variable, or property related to the code that
you’re investigating.
Entering debugging mode
In order to access the Debugger window, a break must occur in a script. A break occurs when
Director encounters a script error or a breakpoint in a script.
When a script error occurs, the Script Error dialog box appears. The dialog box displays
information about the type of error that occurred, and asks you whether you want to debug the
script, edit the script in the Script window, or cancel.
To enter debugging mode, do one of the following:
• Click Debug in the Script Error dialog box.
• Place a breakpoint in a script.
When Director runs and encounters a breakpoint, the script stops executing and the Script
window changes to debugging mode. The movie is still playing, but the execution of your scripts
is stopped until you use the Debugger to tell Director how to proceed. If you have multiple Script
windows open, Director searches for one containing the script where the breakpoint occurred and
changes that window to debugging mode.